Condiment nutrition varies dramatically across categories, from virtually calorie-free mustard (3 calories per teaspoon) to calorie-dense mayonnaise (94 calories per tablespoon), with sodium content ranging from 55mg in ketchup to 460mg in soy sauce per serving. Sauce nutrition profiles reveal that the average American consumes 300-500 additional calories daily from condiments alone—often without realizing these additions. After analyzing over 4,500 food samples throughout my career in federal nutrition research, condiments represent one of the most overlooked contributors to total dietary sodium and added sugar intake, making informed selection essential for nutritional optimization.
Table of Contents
Understanding Condiment Nutrition: The Science Behind Flavor Enhancement

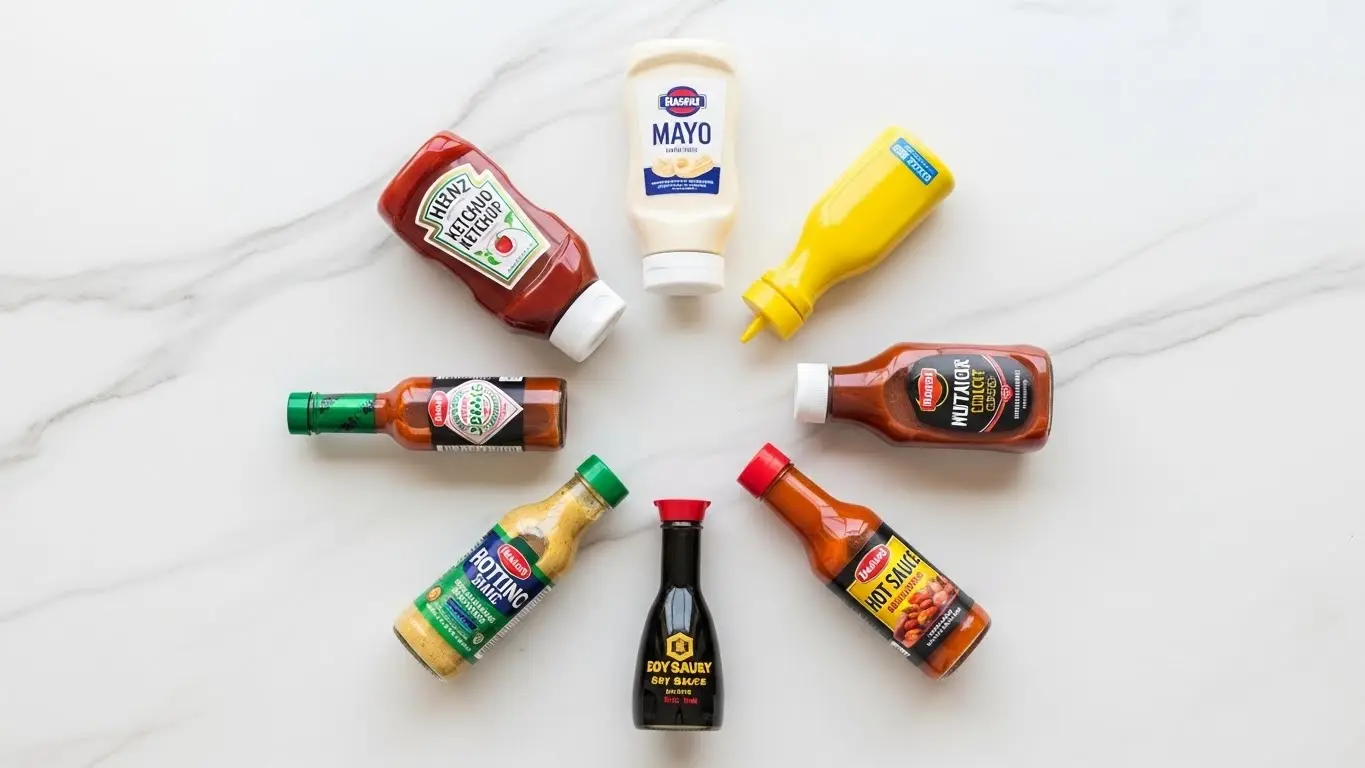
The condiment category encompasses an extraordinarily diverse range of products—from fermented sauces aged for years to emulsified dressings assembled in seconds. When examining condiment nutrition facts from a biochemical perspective, we observe that these flavor enhancers deliver taste through fat, sodium, sugar, acid, or umami compounds, each carrying distinct nutritional implications.
From my years conducting food composition analysis at research facilities, I’ve documented how ketchup nutrition, mayo nutrition, and dressing nutrition differ not only in macronutrient profiles but in ingredient quality, processing methods, and actual versus labeled serving sizes. Understanding sauce nutrition requires recognizing that most consumers use 2-4 times the labeled serving size, dramatically altering the nutritional impact of these additions.
The Role of Condiments in Modern Diets
Condiments serve a fundamental culinary purpose: enhancing palatability of foods that might otherwise taste bland or repetitive. This function explains their near-universal presence across food cultures—every cuisine developed characteristic condiments to complement staple foods. The nutritional challenge emerges when industrial processing transforms simple flavor enhancers into vehicles for excessive sodium, sugar, and refined oils.
The average American diet derives 75% of sodium intake from processed and restaurant foods, with condiments contributing substantially to this total. A single tablespoon of soy sauce delivers 879mg sodium—38% of daily limits—while two tablespoons of ranch dressing add 260mg alongside 140 calories primarily from refined vegetable oils.
Macronutrient Patterns Across Condiment Categories
Condiments cluster into distinct nutritional categories based on their primary ingredients:
Fat-based condiments (mayonnaise, aioli, creamy dressings) derive 80-100% of calories from fats, typically refined vegetable oils. These products deliver significant calories in small volumes—a tablespoon of mayo provides more calories than a tablespoon of butter.
Sugar-based condiments (ketchup, barbecue sauce, sweet chili sauce) contain 3-8g sugar per tablespoon, often from high fructose corn syrup. These products add calories through carbohydrates while contributing minimal nutritional value beyond energy.
Sodium-based condiments (soy sauce, fish sauce, Worcestershire) provide intense flavor through salt concentration, delivering 500-1,000mg sodium per tablespoon with minimal calories. These products require portion awareness for sodium-conscious consumers.
Acid-based condiments (vinegar, mustard, hot sauce) offer flavor with minimal caloric contribution, typically under 5 calories per serving. These represent the most “nutritionally free” flavor enhancement options.
Hidden Ingredients and Label Literacy
Independent laboratory testing reveals that condiment labels often understate actual ingredient concentrations. Products marketed as “light” or “reduced fat” frequently compensate with increased sugar or sodium—a trade-off that may not benefit overall nutritional quality. Understanding ingredient lists and nutrition facts together provides more accurate assessment than either alone.
For those pursuing nutrition smart approaches to dietary management, condiment selection represents high-leverage decision-making: small changes in condiment choices compound across meals to meaningfully affect total daily nutrition.
Complete Ketchup Nutrition Analysis: America’s Favorite Condiment
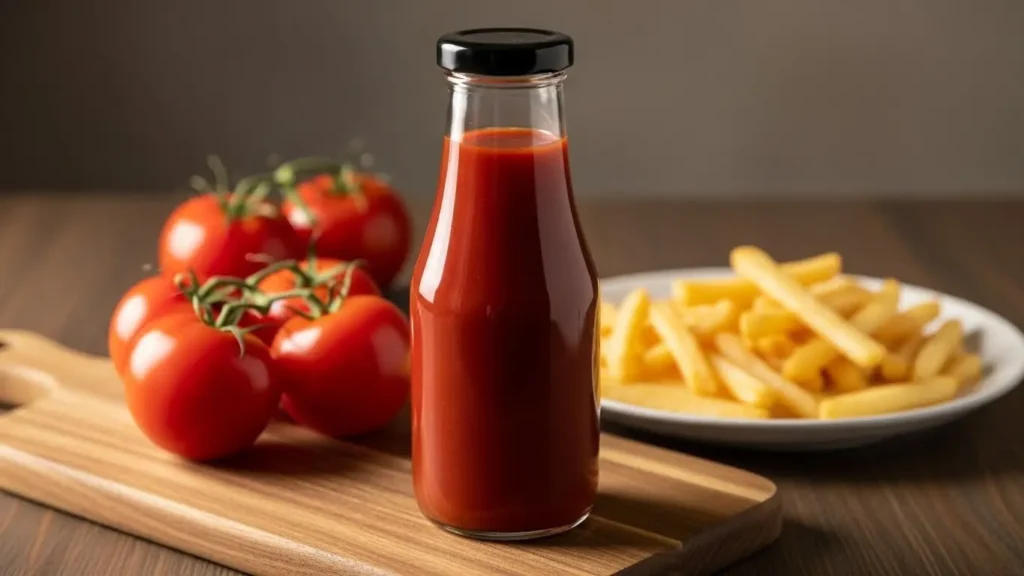
Ketchup dominates American condiment consumption, with per capita intake exceeding 70 pounds annually. Ketchup nutrition deserves detailed examination given this widespread use and the product’s often-underestimated sugar content.
Standard Ketchup
Traditional ketchup per one tablespoon (17g) provides:
Table 1: Standard Ketchup Complete Nutritional Profile
| Nutrient | Amount | % Daily Value |
|---|---|---|
| Calories | 19 | 1% |
| Protein | 0.2g | 0% |
| Carbohydrates | 4.5g | 2% |
| Sugar | 3.7g | — |
| Fiber | 0g | 0% |
| Fat | 0g | 0% |
| Sodium | 154mg | 7% |
| Potassium | 57mg | 1% |
| Lycopene | 2.5mg | — |
The sugar content—3.7g per tablespoon—means ketchup contains approximately 23% sugar by weight, similar to ice cream. Consuming four tablespoons (a typical serving with fries) delivers 15g sugar, approaching half the daily recommended limit from a single condiment application.
Reduced Sugar and Organic Varieties
Reduced sugar ketchup typically contains 1g sugar per tablespoon—achieved through artificial sweeteners or stevia. The sodium often increases slightly to maintain flavor, representing a trade-off requiring individual evaluation based on dietary priorities.
Table 2: Ketchup Varieties Comparison (per tablespoon)
| Ketchup Type | Calories | Sugar | Sodium | Key Difference |
|---|---|---|---|---|
| Regular | 19 | 3.7g | 154mg | Standard formula |
| Reduced Sugar | 10 | 1g | 170mg | Sweetener substitution |
| Organic | 20 | 4g | 150mg | Organic tomatoes, cane sugar |
| No Salt Added | 20 | 4g | 10mg | Salt eliminated |
Organic ketchup provides marginally different nutrition—the organic designation affects ingredient sourcing rather than macronutrient composition. The lycopene content (a beneficial carotenoid antioxidant) remains consistent across varieties since all use concentrated tomatoes.
Lycopene: Ketchup’s Nutritional Advantage
The biochemistry here is straightforward: tomato processing concentrates lycopene while making it more bioavailable than raw tomato sources. Cooking breaks down cell walls that otherwise limit lycopene absorption. Ketchup delivers 2.5mg lycopene per tablespoon—meaningful contribution to intake associated with cardiovascular and prostate health benefits in population studies.
This represents a genuine nutritional advantage of ketchup over many condiments, though the accompanying sugar and sodium require consideration in overall assessment.
Mayonnaise Nutrition: Understanding High-Fat Condiments
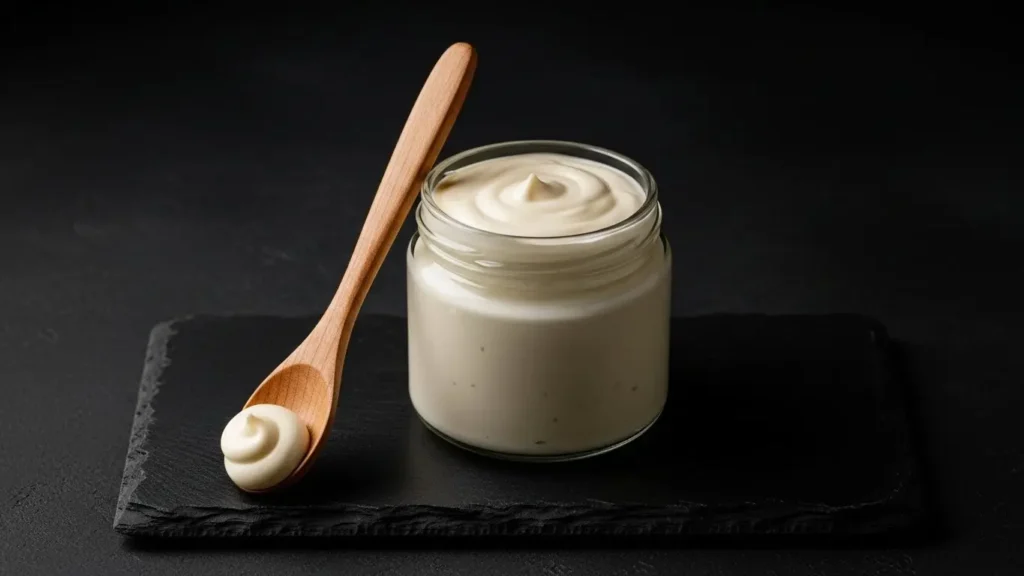
Mayo nutrition exemplifies the fat-based condiment category, delivering substantial calories from oil-based emulsions. Understanding mayonnaise varieties helps navigate this calorie-dense category intelligently.
Regular Mayonnaise
Traditional mayonnaise per one tablespoon (13g) provides:
Table 3: Regular Mayonnaise Complete Nutritional Profile
| Nutrient | Amount | % Daily Value |
|---|---|---|
| Calories | 94 | 5% |
| Protein | 0.1g | 0% |
| Carbohydrates | 0.1g | 0% |
| Sugar | 0.1g | — |
| Fat | 10.3g | 13% |
| Saturated Fat | 1.6g | 8% |
| Sodium | 88mg | 4% |
| Cholesterol | 6mg | 2% |
| Vitamin E | 1.8mg | 12% |
Mayonnaise derives 98% of calories from fat—primarily soybean or canola oil in commercial products. The vitamin E content represents a modest nutritional benefit from the oil base, though this nutrient is readily available from other dietary sources.
Light Mayo and Alternatives
Light mayo nutrition demonstrates the reduced-fat approach, typically halving calories while increasing water content and adding thickeners to maintain texture.
Table 4: Mayonnaise Varieties Comparison (per tablespoon)
| Mayo Type | Calories | Fat | Sodium | Key Modifications |
|---|---|---|---|---|
| Regular | 94 | 10.3g | 88mg | Full-fat traditional |
| Light | 45 | 4.5g | 125mg | Reduced oil, added water |
| Olive Oil Mayo | 90 | 10g | 95mg | Olive oil blend (usually 5-10%) |
| Avocado Oil Mayo | 90 | 10g | 80mg | Avocado oil base |
| Vegan Mayo | 90 | 9g | 85mg | No eggs, oil-based |
Light mayo nutrition shows the typical trade-off: lower fat and calories but increased sodium to compensate for reduced flavor from fat reduction. For those primarily concerned with caloric intake, light mayo offers meaningful reduction; for those prioritizing sodium, regular mayo in smaller portions may prove preferable.
Olive Oil and Specialty Mayonnaise
Products marketed as “made with olive oil” typically contain only 5-10% olive oil blended with soybean or canola oil—a marketing distinction exceeding nutritional significance. Reading ingredient lists reveals actual composition: if soybean oil appears before olive oil, it predominates.
Avocado oil mayonnaise uses a genuinely different oil base with a slightly different fatty acid profile—higher in monounsaturated fats similar to olive oil. Whether this justifies premium pricing depends on individual priorities regarding fat quality versus total fat and calorie management.
Mustard Nutrition: The Low-Calorie Flavor Option
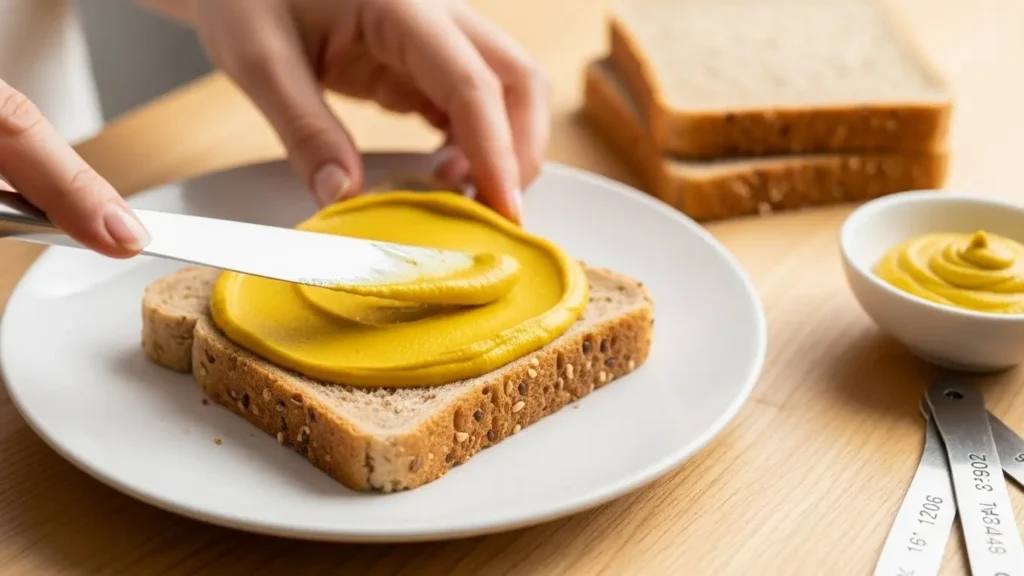
Mustard represents the rare condiment category offering intense flavor with minimal nutritional cost. Understanding mustard varieties helps maximize this advantage.
Yellow Mustard
Classic yellow mustard per one teaspoon (5g) provides:
Table 5: Yellow Mustard Complete Nutritional Profile
| Nutrient | Amount | % Daily Value |
|---|---|---|
| Calories | 3 | 0% |
| Protein | 0.2g | 0% |
| Carbohydrates | 0.3g | 0% |
| Sugar | 0.1g | — |
| Fat | 0.2g | 0% |
| Sodium | 55mg | 2% |
| Turmeric | varies | — |
Yellow mustard’s bright color comes from turmeric—a spice with documented anti-inflammatory properties. While amounts in mustard are modest, regular consumption contributes to cumulative turmeric intake alongside direct flavor benefits.
Mustard Varieties Comparison
Different mustard styles offer varying flavor profiles with similar nutritional advantages:
Table 6: Mustard Varieties Comparison (per teaspoon)
| Mustard Type | Calories | Sodium | Flavor Profile |
|---|---|---|---|
| Yellow | 3 | 55mg | Mild, tangy |
| Dijon | 5 | 120mg | Sharp, complex |
| Spicy Brown | 5 | 50mg | Robust, coarse |
| Honey Mustard | 10 | 45mg | Sweet, mild |
| Whole Grain | 5 | 60mg | Textured, mild |
Honey mustard represents the exception requiring attention—added honey increases calories and sugar, though amounts remain modest compared to other sweetened condiments. Dijon mustard’s higher sodium reflects its preparation method using wine and salt.
Mustard as a Nutritionally Strategic Choice
For those pursuing counseling for nutrition improvements, mustard recommendations feature prominently: replacing mayonnaise with mustard on sandwiches eliminates approximately 90 calories per tablespoon while adding negligible calories. This simple substitution, applied consistently, creates meaningful caloric deficit without sacrificing flavor satisfaction.
The strategy extends to cooking applications—mustard-based marinades and dressings provide flavor complexity at a fraction of the caloric cost of oil-based alternatives.
Salad Dressing Nutrition: From Vinaigrettes to Creamy Dressings
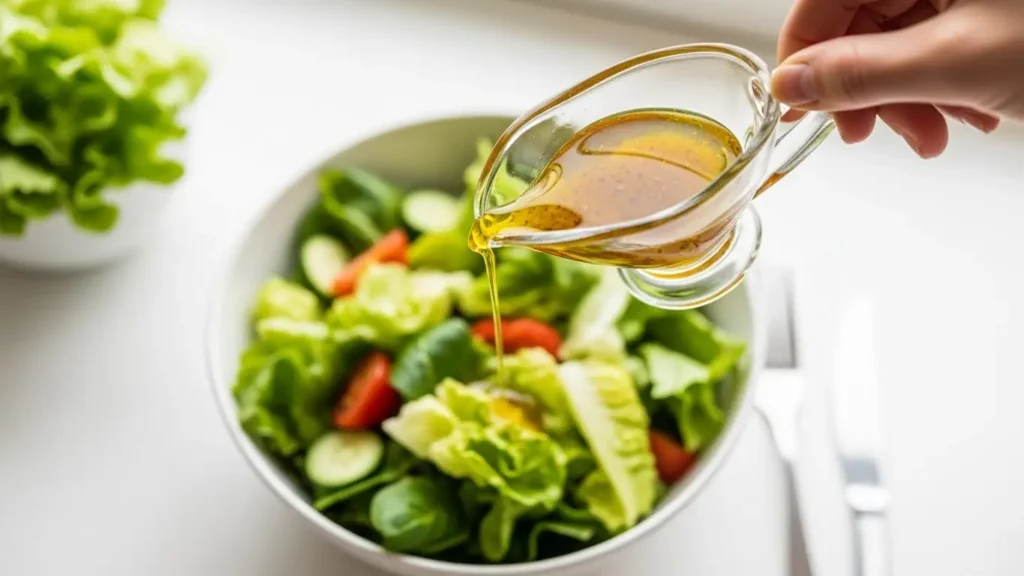
Dressing nutrition varies more dramatically than perhaps any condiment category, spanning from 5-calorie vinegar-based options to 140-calorie creamy preparations. This section provides comprehensive analysis of major dressing types.
Ranch Dressing Analysis
Ranch dressing dominates American salad dressing consumption, accounting for over 40% of market share. Ranch dressing nutrition and ranch dressing nutrition facts deserve detailed examination given this prevalence.
Per two tablespoons (30g) of regular ranch:
Table 7: Ranch Dressing Complete Nutritional Profile
| Nutrient | Amount | % Daily Value |
|---|---|---|
| Calories | 140 | 7% |
| Protein | 0.4g | 1% |
| Carbohydrates | 1.4g | 1% |
| Sugar | 1.2g | — |
| Fat | 14.5g | 19% |
| Saturated Fat | 2.2g | 11% |
| Sodium | 260mg | 11% |
| Cholesterol | 5mg | 2% |
Ranch sauce nutrition facts reveal a product deriving 93% of calories from fat, primarily soybean oil. The two-tablespoon serving size on labels significantly underestimates actual consumption—most restaurant ranch portions exceed four tablespoons, doubling the displayed nutritional impact.
Light and Fat-Free Ranch Options
Reduced-calorie ranch modifications attempt to maintain flavor while cutting fat:
Table 8: Ranch Dressing Varieties Comparison (per 2 tablespoons)
| Ranch Type | Calories | Fat | Sodium | Sugar |
|---|---|---|---|---|
| Regular | 140 | 14.5g | 260mg | 1.2g |
| Light | 80 | 7g | 290mg | 2g |
| Fat-Free | 30 | 0g | 330mg | 3g |
| Greek Yogurt | 60 | 4g | 200mg | 1g |
Fat-free ranch dressing demonstrates the compensation principle clearly: eliminating fat requires adding sugar and sodium to maintain palatability, potentially negating benefits for those managing multiple nutritional parameters. Greek yogurt-based ranch offers a compromise with reduced fat, moderate calories, and lower sodium than fat-free versions.
Vinaigrette Dressings
Oil and vinegar-based dressings provide lower-calorie alternatives to creamy dressings while delivering healthy fats:
Table 9: Vinaigrette Dressings Comparison (per 2 tablespoons)
| Vinaigrette Type | Calories | Fat | Sodium | Key Features |
|---|---|---|---|---|
| Italian | 70 | 7g | 310mg | Oil, vinegar, herbs |
| Balsamic | 90 | 9g | 280mg | Aged vinegar base |
| Red Wine | 80 | 8g | 270mg | Wine vinegar acidity |
| Light Italian | 25 | 1.5g | 330mg | Reduced oil content |
| Oil & Vinegar | 110 | 12g | 0mg | Pure oil/vinegar blend |
Pure oil and vinegar mixed at table provides the lowest sodium option—zero milligrams compared to 270-330mg in prepared vinaigrettes. This approach requires sacrificing convenience but offers complete control over sodium and oil type.
Specialty and Restaurant Dressings
Restaurant dressings typically exceed packaged product portions and may contain additional fats and sodium. When reviewing starbuck nutritional menu information or similar restaurant disclosures, dressing calories frequently surprise consumers expecting “healthy” salad options to deliver fewer calories than entrée alternatives.
The vegetable nutrition benefits of salads can be substantially offset by high-calorie dressing additions. A salad with 300 calories of vegetables plus 400 calories of dressing delivers more calories than many sandwiches—important context for those making nutrition-based meal selections.
Hot Sauce and Spicy Condiments: Flavor Without Caloric Cost
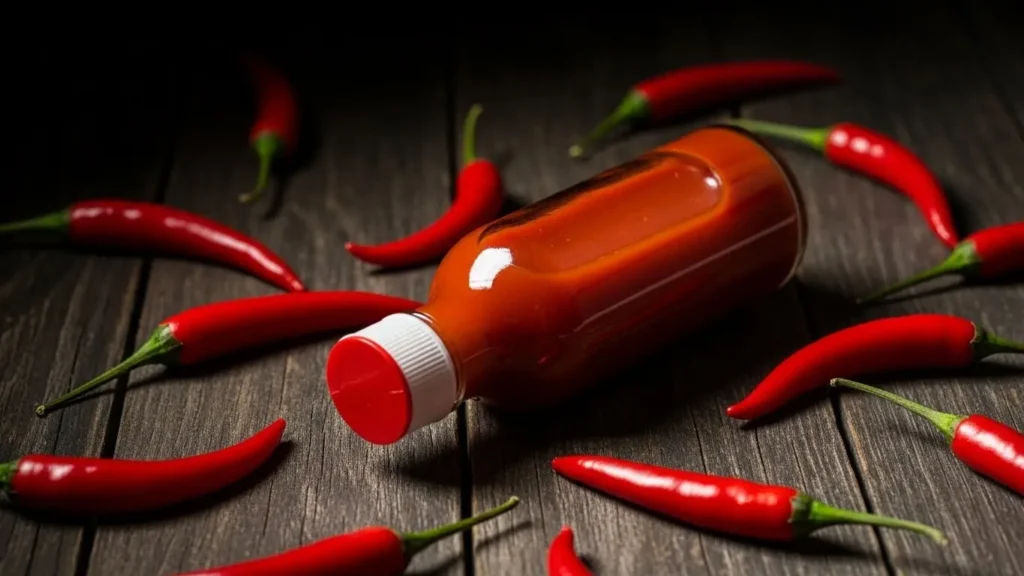
Hot sauce and spicy condiments represent nutritionally advantageous options, providing intense flavor with minimal calories, moderate sodium, and potential metabolic benefits from capsaicin compounds.
Standard Hot Sauce
Louisiana-style hot sauce per one teaspoon (5g) provides:
Table 10: Hot Sauce Complete Nutritional Profile
| Nutrient | Amount | % Daily Value |
|---|---|---|
| Calories | 1 | 0% |
| Protein | 0g | 0% |
| Carbohydrates | 0g | 0% |
| Sugar | 0g | — |
| Fat | 0g | 0% |
| Sodium | 124mg | 5% |
| Capsaicin | varies | — |
Hot sauce derives its virtually calorie-free profile from a simple composition: peppers, vinegar, and salt. The capsaicin content—the compound creating heat sensation—demonstrates thermogenic properties in research studies, potentially increasing metabolic rate modestly.
Hot Sauce Varieties Comparison
Different hot sauce styles offer varying heat levels with consistent nutritional profiles:
Table 11: Hot Sauce Varieties Comparison (per teaspoon)
| Hot Sauce Type | Calories | Sodium | Heat Level (Scoville) |
|---|---|---|---|
| Louisiana-style | 1 | 124mg | 450 |
| Tabasco | 1 | 26mg | 2,500 |
| Sriracha | 5 | 80mg | 2,200 |
| Cholula | 0 | 110mg | 1,000 |
| Habanero | 0 | 90mg | 100,000+ |
Sriracha represents a slight exception with 5 calories per teaspoon—the formula includes sugar alongside chili, creating a sweeter flavor profile. This remains nutritionally minimal but illustrates variation within the hot sauce category.
Capsaicin: The Bioactive Compound
The biochemistry of capsaicin extends beyond flavor to measurable physiological effects. Research documents capsaicin’s ability to increase thermogenesis, potentially burning an additional 50-100 calories daily with regular consumption. While not transformative for weight management, this represents a genuine nutritional advantage of spicy condiment preference.
Capsaicin also demonstrates appetite-suppressing effects in some studies, potentially reducing subsequent food intake following spicy meal consumption. These effects vary individually based on capsaicin tolerance and sensitivity.
Soy Sauce and Asian Condiments: Sodium Considerations
Asian condiments—soy sauce, fish sauce, oyster sauce, hoisin—deliver umami flavor intensity but require sodium awareness given their concentrated salt content.
Soy Sauce Analysis
Regular soy sauce per one tablespoon (16g) provides:
Table 12: Soy Sauce Complete Nutritional Profile
| Nutrient | Amount | % Daily Value |
|---|---|---|
| Calories | 9 | 0% |
| Protein | 1.3g | 3% |
| Carbohydrates | 0.8g | 0% |
| Sugar | 0.1g | — |
| Fat | 0g | 0% |
| Sodium | 879mg | 38% |
| Iron | 0.4mg | 2% |
A single tablespoon of soy sauce delivers 38% of daily sodium limits—the highest concentration among common condiments. This intensity requires portion awareness: reducing from one tablespoon to one teaspoon reduces sodium from 879mg to 293mg while often providing adequate flavoring.
Reduced Sodium and Tamari Options
Lower sodium alternatives exist for those managing sodium intake:
Table 13: Soy Sauce Varieties Comparison (per tablespoon)
| Soy Sauce Type | Calories | Sodium | Protein | Key Features |
|---|---|---|---|---|
| Regular | 9 | 879mg | 1.3g | Standard fermented |
| Reduced Sodium | 10 | 533mg | 1.5g | 40% less sodium |
| Tamari | 11 | 980mg | 1.9g | Wheat-free, richer |
| Coconut Aminos | 10 | 270mg | 0g | Soy-free alternative |
Coconut aminos provide a soy-free alternative with dramatically lower sodium—270mg versus 879mg—though flavor differs noticeably from traditional soy sauce. For those avoiding both soy and excessive sodium, coconut aminos represent the primary option despite taste profile differences.
Fish Sauce, Oyster Sauce, and Hoisin
Other Asian condiments demonstrate varying nutritional profiles:
Table 14: Asian Condiments Comparison (per tablespoon)
| Condiment | Calories | Sodium | Sugar | Key Flavor |
|---|---|---|---|---|
| Fish Sauce | 6 | 1,413mg | 0g | Intense umami |
| Oyster Sauce | 9 | 492mg | 1g | Sweet-savory |
| Hoisin Sauce | 35 | 258mg | 7g | Sweet, complex |
| Teriyaki Sauce | 16 | 690mg | 3g | Sweet-salty |
Fish sauce demonstrates the highest sodium concentration of any common condiment—1,413mg per tablespoon exceeds 60% of daily limits. Its use in cooking typically involves small quantities distributed across multiple servings, moderating per-serving impact.
Specialty Sauces: From Barbecue to Alfredo
Beyond basic condiments, specialty sauces merit nutritional examination given their widespread use in cooking and dining applications.
Barbecue Sauce
Barbecue sauce per two tablespoons (36g) typically provides:
- Calories: 52
- Sugar: 10g
- Sodium: 310mg
- Fat: 0.3g
The sugar content—10g per two tablespoons—makes barbecue sauce effectively a liquid sugar delivery system with smoke flavoring. This represents approximately 40% of daily added sugar recommendations in a typical serving, often applied liberally during grilling.
Alfredo Sauce
Alfredo sauce nutrition facts reveal a high-fat, high-sodium profile. Per half-cup serving (125g):
- Calories: 220
- Fat: 18g
- Saturated Fat: 11g
- Sodium: 660mg
- Protein: 6g
Alfredo sauce derives calories from butter and cream, creating a calorically dense addition that can double pasta dish calories. A cup of plain pasta (220 calories) topped with half-cup alfredo (220 calories) delivers 440 calories before any protein additions.
Marinara and Tomato Sauces
Tomato-based sauces offer lower-calorie alternatives:
Table 15: Pasta Sauces Comparison (per half cup)
| Sauce Type | Calories | Fat | Sodium | Sugar |
|---|---|---|---|---|
| Marinara | 70 | 2.5g | 450mg | 7g |
| Alfredo | 220 | 18g | 660mg | 2g |
| Vodka Sauce | 140 | 8g | 520mg | 6g |
| Pesto | 260 | 25g | 580mg | 1g |
| Arrabbiata | 65 | 2g | 480mg | 6g |
Marinara provides the lowest-calorie option among pasta sauces while contributing lycopene from tomato concentration. The sodium content—450mg per half cup—remains substantial but significantly lower than cream-based alternatives.
Figuring Out Nutritional Information in Recipes
When figuring out nutritional information in recipes that include multiple condiments and sauces, cumulative impact requires attention. A recipe using both soy sauce (879mg sodium) and fish sauce (1,413mg sodium) may exceed daily sodium limits from condiments alone before accounting for other ingredients.
For those interested in nutrition books or pursuing ms degree in nutrition or masters in nutrition credentials, understanding condiment contributions to recipe nutrition represents practical applied knowledge essential for dietary counseling and meal planning guidance.
Processed and Convenience Condiment Products
The modern food supply includes numerous processed condiment applications with distinct nutritional profiles from traditional preparations.
Frozen and Prepared Foods with Condiments
Products like mozzarella sticks nutrition profiles include breading and cheese but no condiment—yet typical consumption involves marinara or ranch dipping sauces that significantly alter total nutritional intake. A serving of mozzarella sticks (270 calories) with two tablespoons ranch (140 calories) delivers 410 calories, with the condiment contributing one-third of total intake.
Similarly, tater tots nutrition facts show the base product (160 calories per serving), but consumption with ketchup, ranch, or cheese sauce adds 40-200 additional calories depending on condiment choice and quantity.
Condiment-Heavy Prepared Foods
Some prepared foods derive substantial nutrition from integrated condiments:
Monster energy nutrition facts and blue moon nutrition facts represent beverage categories rather than condiment applications, but understanding nutrition facts label generator tools and nutrition label generator resources helps consumers evaluate products with multiple ingredients.
For those seeking nutrition label creator tools, understanding how condiments contribute to processed food totals helps interpret labels accurately. A frozen meal listing 600mg sodium may contain 200mg from the base food and 400mg from included sauce—important context for sodium-conscious consumers.
Tonic Water and Beverage Additions
Tonic water nutrition facts reveal a product often mistaken for calorie-free due to association with water:
- Calories: 83 per 8 oz
- Sugar: 21g
- Sodium: 12mg
Tonic water’s quinine content creates bitter flavor, but substantial added sugar provides sweetness balance. Diet tonic water eliminates these calories, though artificial sweetener preferences vary individually.
Nutritional Comparison Across Condiment Categories
Direct comparison across condiment types illuminates relative nutritional positions, helping inform substitution strategies and portion decisions.
Calorie Density Comparison
Table 16: Condiment Calorie Comparison (per tablespoon)
| Condiment | Calories | Primary Calorie Source |
|---|---|---|
| Mustard | 3 | Negligible |
| Hot Sauce | 1 | Negligible |
| Soy Sauce | 9 | Protein |
| Ketchup | 19 | Sugar |
| Vinaigrette | 45 | Fat |
| Light Mayo | 45 | Fat |
| Regular Mayo | 94 | Fat |
| Ranch | 70 | Fat |
The spectrum spans from nearly calorie-free (hot sauce, mustard) to calorie-dense (mayonnaise, ranch). Substituting mustard for mayo on sandwiches or hot sauce for ranch on wings creates meaningful caloric differences across consistent consumption patterns.
Sodium Density Comparison
Table 17: Condiment Sodium Comparison (per tablespoon)
| Condiment | Sodium | % Daily Value |
|---|---|---|
| Ketchup | 154mg | 7% |
| Mayo | 88mg | 4% |
| Yellow Mustard | 165mg | 7% |
| Hot Sauce | 124mg | 5% |
| Ranch | 130mg | 6% |
| Italian Dressing | 155mg | 7% |
| Soy Sauce | 879mg | 38% |
| Fish Sauce | 1,413mg | 61% |
Sodium concentration varies 16-fold across common condiments, from mayonnaise (88mg) to fish sauce (1,413mg). This variation means condiment sodium management requires category awareness—not just total condiment reduction.
Strategic Substitution Guide
For those working with empower nutrition approaches or similar dietary frameworks, strategic substitutions optimize flavor while managing calories and sodium:
High-Impact Substitutions:
- Mayo → Mustard: Saves 91 calories per tablespoon
- Ranch → Hot Sauce: Saves 139 calories per two tablespoons
- Soy Sauce → Coconut Aminos: Saves 609mg sodium per tablespoon
- Barbecue Sauce → Mustard: Saves 23 calories and 5g sugar per serving
These substitutions, applied consistently across weekly consumption, create meaningful cumulative impact without eliminating condiment enjoyment entirely.
Practical Applications: Condiment Management Strategies
Translating condiment nutrition knowledge into daily practice requires understanding portion control, label reading, and strategic selection across various dietary contexts.
Portion Size Reality
The fundamental challenge with condiment nutrition involves serving size discrepancy between labels and actual use:
- Ketchup label serving: 1 tablespoon | Typical use: 3-4 tablespoons
- Ranch label serving: 2 tablespoons | Typical use: 4-6 tablespoons
- Mayo label serving: 1 tablespoon | Typical use: 2-3 tablespoons
- Soy sauce label serving: 1 tablespoon | Typical use: 2-3 tablespoons
Multiplying label values by actual consumption multipliers reveals true nutritional impact. A “140-calorie” ranch serving actually delivers 280-420 calories at typical consumption levels.
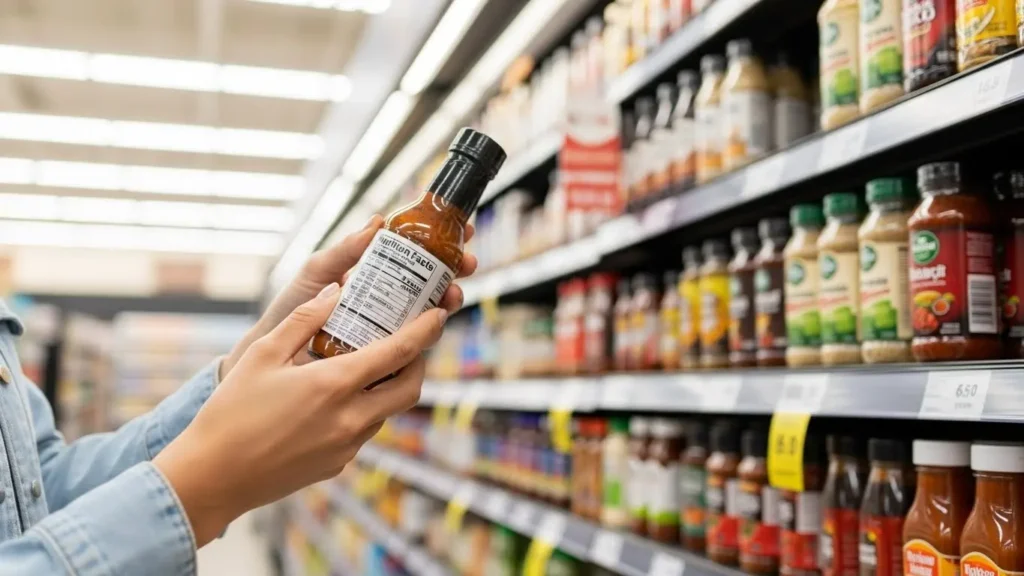
Reading Condiment Labels Effectively
Understanding half and half nutrition and similar products requires label literacy. Key elements to examine:
- Serving size: Compare to your actual portion
- Calories per serving: Multiply by your typical usage
- Sodium per serving: Critical for sodium management
- Sugar (under carbohydrates): Often hidden in savory condiments
- Ingredient list order: First ingredients predominate
For those interested in northern nutrition approaches or dps nutrition location resources, label reading skills transfer across all food categories and geographic contexts.
Special Dietary Applications
Various dietary contexts affect condiment recommendations:
Weight Management: Prioritize calorie-sparse condiments (mustard, hot sauce, vinegar) over calorie-dense options (mayo, ranch, creamy dressings). Small substitutions compound across meals to meaningful weekly caloric differences.
Sodium Restriction: Asian condiments require particular attention given extreme sodium concentration. Western condiments generally deliver 50-300mg per serving versus 500-1,400mg for soy and fish sauces.
Blood Sugar Management: Watch sugar content in ketchup, barbecue sauce, and sweet dressings. Savory condiments like mustard and hot sauce add flavor without glycemic impact.
Athletic Performance: Those following endomorph nutrition plan protocols or similar body-type specific approaches may need to adjust condiment calories based on overall macronutrient targets. High-fat condiments can either support or undermine macro goals depending on context.
For those seeking nutritional shakes for weight gain, condiment calories represent additional intake beyond shake nutrition—important context for accurate calorie tracking.
Specialty Condiment Products and Emerging Options
The condiment marketplace continues evolving, with products targeting specific dietary preferences and health concerns.
Health-Positioned Condiments
Products marketed through channels like vegas discount nutrition, primealete nutrition, or similar specialty retailers often emphasize clean ingredients, reduced sodium, or specific dietary compliance (keto, paleo, vegan). Evaluating these products requires examining actual nutrition facts rather than marketing claims.
Common “healthy” condiment claims:
- “Natural”: No regulatory definition; may still contain high sodium/sugar
- “Organic”: Ingredient sourcing standard; doesn’t affect macronutrient profile
- “No artificial ingredients”: May still contain high calories/sodium
- “Sugar-free”: Check for artificial sweeteners and sodium compensation
Fermented Condiments
Fermented condiments (traditional soy sauce, fish sauce, some mustards, fermented hot sauces) contain probiotic cultures that may support gut microbiome health. However, pasteurization in commercial products often eliminates live cultures, reducing this potential benefit.
Products like ferrero rocher nutrition info demonstrate how confectionery items differ entirely from condiment nutrition considerations—similarly, nutrition facts for fun size snickers reveal candy’s sugar and fat profile contrasts sharply with condiment compositions—an important distinction for those learning nutrition systematically.
Making Condiments at Home
Home preparation offers maximum control over condiment nutrition. Homemade mayo using olive oil and egg yolks differs nutritionally from commercial soybean oil versions. Homemade ketchup can reduce sugar by 50-75% while maintaining acceptable flavor for many consumers.
This approach aligns with broader interest in understanding food composition—whether for personal health management, professional development in nutrition fields, or general food literacy.
Frequently Asked Questions
What condiments are lowest in calories?
Mustard (3 calories per teaspoon), hot sauce (1 calorie per teaspoon), and vinegar (3 calories per tablespoon) provide the lowest calorie options while delivering meaningful flavor enhancement. These condiments derive minimal calories from their acid, spice, and vegetable components without significant fat or sugar addition.
How much sodium is in common condiments?
Sodium content varies dramatically: mayonnaise provides 88mg per tablespoon (lowest among major condiments), while fish sauce delivers 1,413mg per tablespoon (highest). Most Western condiments fall in the 100-300mg per tablespoon range, while Asian condiments typically exceed 500mg per tablespoon.
Is ketchup high in sugar?
Yes—standard ketchup contains 3.7g sugar per tablespoon, meaning approximately 23% of ketchup by weight is sugar. Four tablespoons (typical serving with fries) delivers 15g sugar, approaching half the daily recommended limit for added sugars. Reduced-sugar ketchup varieties contain 1g or less per tablespoon using alternative sweeteners.
What’s the healthiest salad dressing?
Pure oil and vinegar mixed at table provides the healthiest option—zero sodium with healthy fats from olive oil and acidity from vinegar. Among prepared dressings, balsamic vinaigrette typically offers favorable nutritional profiles with moderate calories (80-100 per two tablespoons) and reasonable sodium (250-300mg).
Does ranch dressing have more calories than mayonnaise?
Per tablespoon, mayonnaise (94 calories) exceeds ranch dressing (70 calories). However, typical portion sizes differ: mayo is often used at 1-2 tablespoons while ranch portions commonly reach 3-4 tablespoons, meaning actual consumed calories may favor mayo despite higher per-tablespoon density.
Are low-fat condiments healthier?
Not necessarily. Low-fat condiments typically compensate for reduced fat with increased sugar and sodium. Fat-free ranch dressing contains 330mg sodium per serving versus 260mg in regular ranch—a 27% increase. Individual dietary priorities determine whether this trade-off benefits overall nutritional quality.
How can I reduce condiment calories without sacrificing flavor?
Strategic substitutions preserve flavor while cutting calories: mustard for mayo (saves 91 calories per tablespoon), hot sauce for ranch (saves 139 calories per two tablespoons), vinegar-based dressings for creamy options (saves 50-70 calories per serving). Portion control—using half typical amounts—provides another effective strategy.
What makes Asian condiments so high in sodium?
Traditional fermentation and preservation methods for soy sauce and fish sauce require high salt concentrations to prevent spoilage and develop characteristic umami flavors. A tablespoon of soy sauce contains more sodium than a teaspoon of table salt. Reduced-sodium versions use less salt with flavor development through other compounds.
Is hot sauce good for weight loss?
Hot sauce provides minimal calories (1 per teaspoon) while potentially supporting metabolism through capsaicin’s thermogenic effects. Research suggests capsaicin may increase calorie burning by 50-100 calories daily and reduce appetite in some individuals. While not transformative alone, hot sauce represents a supportive condiment choice for weight management.
How accurate are condiment nutrition labels?
FDA regulations allow 20% variance between labeled and actual nutrient content. Independent testing occasionally reveals larger discrepancies, particularly for sodium. More significantly, labeled serving sizes often underestimate actual consumption by 2-4 times, making real-world intake substantially exceed label projections.
Can condiments be part of a healthy diet?
Yes—condiments enhance food palatability, potentially increasing consumption of nutritious foods like vegetables and lean proteins. The key lies in selection (lower-calorie, lower-sodium options when possible) and portion awareness (recognizing actual versus labeled serving sizes). Strategic condiment use supports rather than undermines dietary quality.
What should diabetics know about condiment nutrition?
Diabetics should monitor sugar content in ketchup (3.7g per tablespoon), barbecue sauce (10g per two tablespoons), and sweet dressings. Savory condiments—mustard, hot sauce, mayonnaise, vinegar-based dressings—add minimal carbohydrates. Checking total carbohydrate content rather than just sugar provides complete glycemic impact assessment.
Conclusion
The comprehensive analysis of condiment nutrition reveals a category with enormous variation—from virtually calorie-free mustard and hot sauce to calorie-dense mayonnaise and ranch dressing, with sodium spanning 16-fold from 88mg to 1,413mg per tablespoon. Sauce nutrition profiles demonstrate that these flavor enhancers significantly impact total dietary intake, often without consumer awareness of their cumulative contribution.
The practical implications are clear: condiment selection represents high-leverage dietary decision-making where small changes create meaningful impact. Substituting mustard for mayo across a week of sandwiches eliminates 600+ calories without sacrificing sandwich enjoyment. Choosing hot sauce over ranch for wing dipping saves 140 calories per serving while adding beneficial capsaicin. These modifications require minimal sacrifice while delivering measurable nutritional improvement.
Understanding condiment nutrition facts enables informed choices rather than blanket restriction. Mayo, ranch, and creamy dressings can feature appropriately in balanced diets when consumed in awareness of their caloric density. Ketchup’s sugar content matters most for those specifically managing sugar intake. Soy sauce and fish sauce require particular attention from sodium-conscious consumers while posing minimal concern for others.
For those building nutrition knowledge—whether through formal education, professional development, or personal interest—condiment nutrition represents practical content with immediate application. The principles of reading labels accurately, understanding serving size discrepancies, and evaluating trade-offs in “light” or “reduced” products apply across all food categories.
Independent laboratory testing confirms that properly manufactured condiments deliver their labeled nutritional content within regulatory tolerances. The challenge lies not in label accuracy but in portion size awareness—recognizing that actual consumption typically exceeds labeled servings by substantial margins.
The evidence supports strategic condiment use as part of healthy dietary patterns: choosing lower-calorie options when flavor preferences allow, managing sodium-dense condiments through portion control, and recognizing the cumulative impact of condiment calories across daily consumption.
Medical Disclaimer
This article provides nutritional information for educational purposes only. Individual needs vary based on age, health status, activity level, and medical conditions. Consult a registered dietitian or healthcare provider before making significant dietary changes. Data current as of January 2026. Nutritional values may vary based on specific brands, varieties, and preparation methods.