Seafood nutrition delivers unmatched omega-3 fatty acid concentrations alongside high-quality protein—salmon provides 2,260mg omega-3s per 3-ounce serving, tuna offers 25g protein with minimal fat, and shrimp delivers 20g protein at just 84 calories. Fish nutrition profiles reveal that seafood represents the primary dietary source of EPA and DHA, long-chain omega-3s with documented cardiovascular, cognitive, and anti-inflammatory benefits unavailable from plant sources in equivalent forms. After analyzing over 4,500 food samples throughout my career in federal nutrition research, seafood consistently demonstrates exceptional nutrient density for brain-essential fatty acids and bioavailable protein, making it foundational to evidence-based dietary optimization.
Table of Contents
Understanding Seafood Nutrition: The Science Behind Marine Nutrients
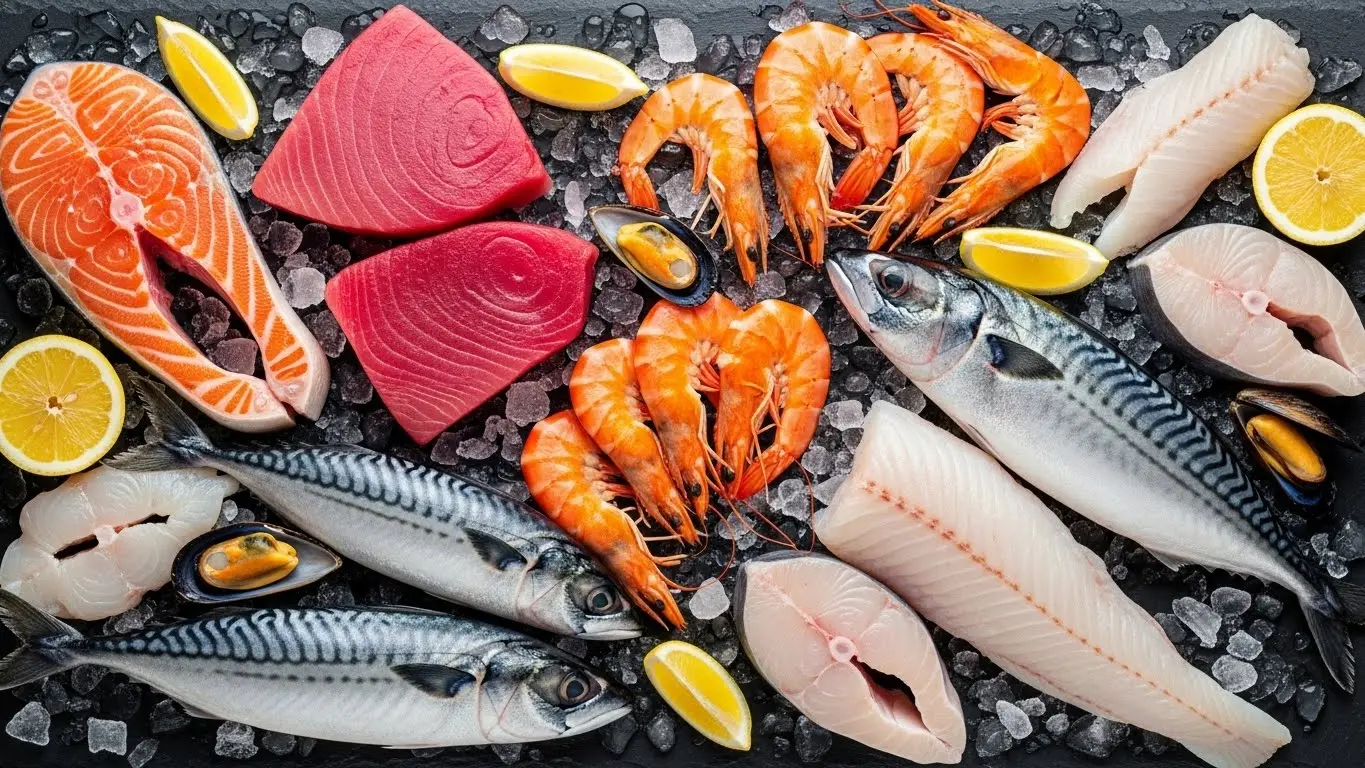
The seafood category encompasses an extraordinary diversity of marine and freshwater species—fish, shellfish, crustaceans, and mollusks—each concentrating different nutrients based on their diet, habitat, and biological characteristics. When examining seafood nutrition facts from a biochemical perspective, we observe that these foods deliver omega-3 fatty acids, complete protein, selenium, and vitamin D in combinations unavailable from any terrestrial food source.
From my years conducting food composition analysis at research facilities, I’ve documented how salmon nutrition, tuna nutrition, and shrimp nutrition differ dramatically based on species, wild versus farmed origin, and preparation methods. The fish nutrition principles that govern how seafood concentrates nutrients explain why fatty fish excel in omega-3 delivery while lean fish provide protein with minimal fat—each serving distinct dietary functions.
Omega-3 Fatty Acids: Seafood’s Signature Nutrient
Omega-3 fatty acids represent seafood’s most significant nutritional contribution—compounds essential for human health that the body cannot synthesize and must obtain from diet. Three types exist: ALA (from plants), EPA, and DHA (primarily from seafood).
The biochemistry here is straightforward: while plant sources provide ALA omega-3s, conversion to the biologically active EPA and DHA forms occurs at rates below 10% in most individuals. Seafood bypasses this inefficient conversion by providing preformed EPA and DHA directly, explaining why fish consumption produces health outcomes that plant omega-3 sources cannot replicate.
EPA and DHA demonstrate documented benefits for:
- Cardiovascular health (reduced triglycerides, blood pressure, arrhythmia risk)
- Brain function (neuronal membrane composition, cognitive performance)
- Inflammation modulation (prostaglandin pathway effects)
- Eye health (retinal DHA concentration)
For those pursuing nutrition coaching careers or seeking nasm nutrition certification credentials, understanding omega-3 biochemistry represents foundational knowledge essential for dietary counseling.
Protein Quality: Complete Amino Acid Profiles
Seafood protein ranks among the highest quality available, providing all essential amino acids in proportions closely matching human requirements. The PDCAAS (Protein Digestibility Corrected Amino Acid Score) for most fish approaches 1.0—the maximum possible score indicating complete, highly digestible protein.
This protein quality makes seafood particularly valuable for:
- Muscle maintenance and growth
- Satiety and appetite regulation
- Tissue repair and immune function
- Metabolic rate support
A 3-ounce serving of most fish provides 20-25g protein—roughly 40-50% of daily needs—at caloric costs ranging from 70 calories (cod) to 175 calories (salmon), making seafood among the most protein-efficient food choices available.
Micronutrient Density
Beyond omega-3s and protein, seafood concentrates several micronutrients at levels exceeding most other foods:
Selenium: Fish provides the most bioavailable selenium source, with 3 ounces of tuna delivering 92mcg (167% daily value). Selenium supports thyroid function, antioxidant systems, and immune health.
Vitamin D: Fatty fish represent one of few significant food sources of vitamin D, with salmon providing 570 IU (71% daily value) per serving—critical given widespread vitamin D insufficiency.
Vitamin B12: Shellfish concentrate B12 at exceptional levels, with clams providing 84mcg (3,500% daily value) per 3-ounce serving.
Iodine: Seafood provides reliable iodine for thyroid hormone synthesis, particularly important for populations with limited iodized salt intake.
Fatty Fish Nutrition: Omega-3 Powerhouses
Fatty fish—salmon, mackerel, sardines, herring—concentrate omega-3 fatty acids at levels making them essential for meeting EPA and DHA requirements. This section provides comprehensive analysis of major fatty fish varieties.
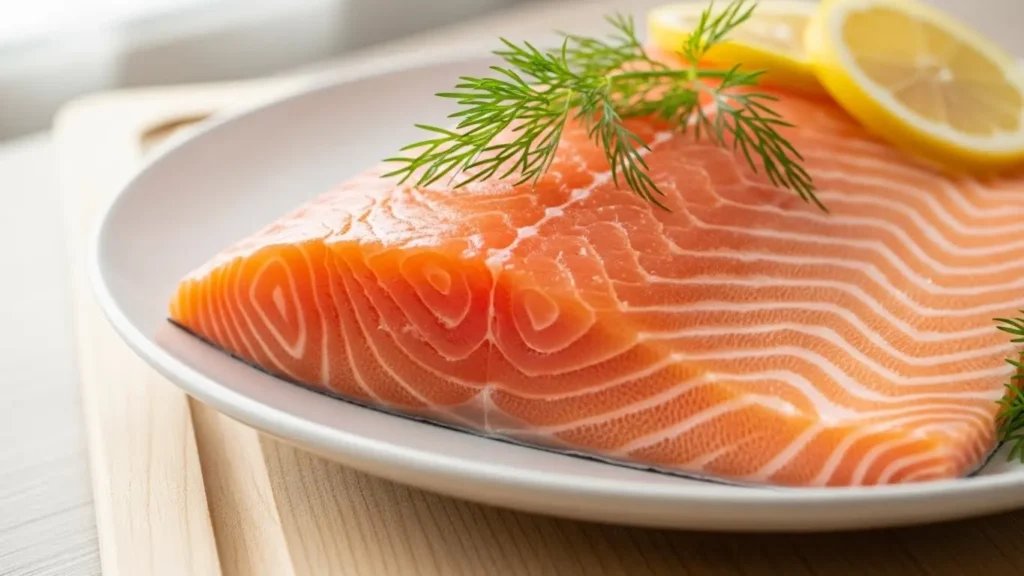
Salmon Nutrition
Atlantic salmon nutrition and nutritional facts of salmon per 3-ounce cooked serving provide exceptional nutrient density. The nutrition info salmon consumers need reveals:
Table 1: Salmon Complete Nutritional Profile (3 oz cooked)
| Nutrient | Amount | % Daily Value |
|---|---|---|
| Calories | 175 | 9% |
| Protein | 19g | 38% |
| Total Fat | 10.5g | 13% |
| Omega-3 (EPA+DHA) | 1,820mg | — |
| Saturated Fat | 2.1g | 11% |
| Vitamin D | 570 IU | 71% |
| Vitamin B12 | 2.6mcg | 108% |
| Selenium | 40mcg | 73% |
| Niacin | 8.6mg | 54% |
| Phosphorus | 214mg | 17% |
The nutrition info on salmon demonstrates why this species dominates omega-3 discussions: nearly 2g EPA+DHA per serving exceeds most other fish substantially. Atlantic salmon nutrition from farmed sources typically contains higher fat (and thus more omega-3s) than wild varieties, though wild salmon provides lower contaminant exposure.
Wild vs. Farmed Salmon Comparison
Table 2: Wild vs. Farmed Salmon Comparison (3 oz cooked)
| Attribute | Wild Salmon | Farmed Salmon |
|---|---|---|
| Calories | 155 | 175 |
| Protein | 22g | 19g |
| Total Fat | 7g | 10.5g |
| Omega-3s | 1,220mg | 1,820mg |
| Vitamin D | 988 IU | 570 IU |
| Contaminants | Lower | Higher |
| Price | Higher | Lower |
Both wild and farmed salmon provide excellent nutrition. Wild salmon offers more protein and vitamin D with fewer contaminants; farmed salmon provides more omega-3s at lower cost. Either choice delivers substantial nutritional benefit compared to non-seafood alternatives.
Mackerel and Sardines
Other fatty fish provide comparable omega-3 density:
Table 3: Fatty Fish Comparison (3 oz cooked)
| Fish | Calories | Protein | Omega-3s | Vitamin D | Mercury |
|---|---|---|---|---|---|
| Salmon | 175 | 19g | 1,820mg | 570 IU | Low |
| Mackerel (Atlantic) | 223 | 20g | 1,020mg | 388 IU | Moderate |
| Sardines | 177 | 21g | 1,260mg | 164 IU | Very Low |
| Herring | 173 | 20g | 1,710mg | 182 IU | Low |
| Anchovies | 111 | 17g | 1,320mg | 62 IU | Very Low |
Sardines and anchovies offer particular advantages: very low mercury due to small size and short lifespan, plus edible bones providing calcium. Their strong flavor limits some applications but makes them valuable for those prioritizing omega-3 intake with minimal contaminant concern.
Lean Fish Nutrition: High Protein, Low Fat Options
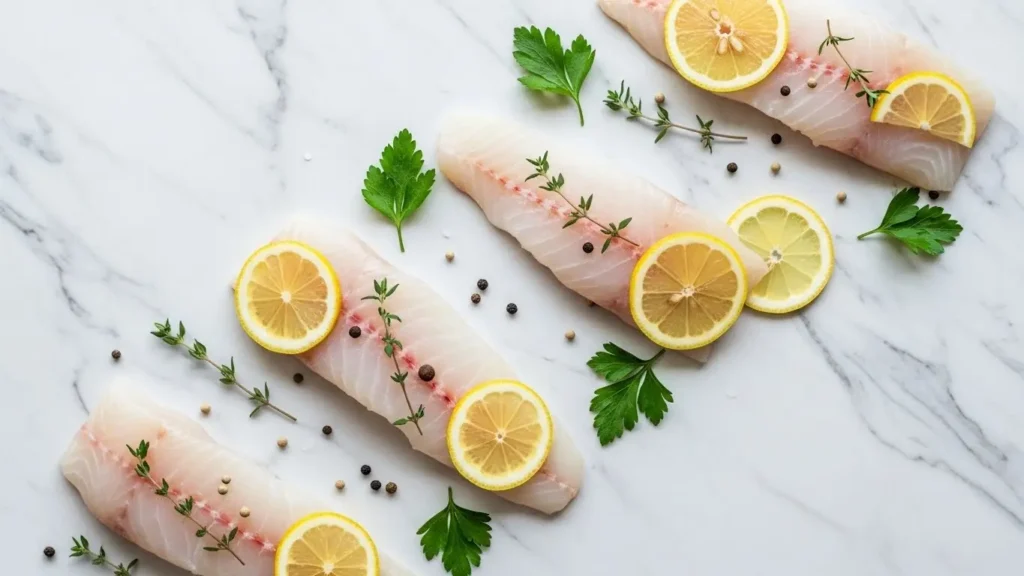
Lean fish—cod, tilapia, halibut, flounder—provide exceptional protein density at minimal caloric cost, making them valuable for those prioritizing protein intake within caloric constraints.
Cod Nutrition
Cod per 3-ounce cooked serving demonstrates the lean fish profile:
Table 4: Cod Complete Nutritional Profile (3 oz cooked)
| Nutrient | Amount | % Daily Value |
|---|---|---|
| Calories | 70 | 4% |
| Protein | 15g | 30% |
| Total Fat | 0.6g | 1% |
| Omega-3s | 158mg | — |
| Cholesterol | 37mg | 12% |
| Vitamin B12 | 0.8mcg | 33% |
| Selenium | 28mcg | 51% |
| Phosphorus | 117mg | 9% |
| Niacin | 1.8mg | 11% |
Cod provides 15g protein at just 70 calories—exceptional protein efficiency for those managing caloric intake. The lower omega-3 content reflects minimal fat storage, making lean fish complementary to rather than replacement for fatty fish in comprehensive dietary patterns.
Tilapia Nutrition
Tilapia per 3-ounce cooked serving:
Table 5: Tilapia Complete Nutritional Profile (3 oz cooked)
| Nutrient | Amount | % Daily Value |
|---|---|---|
| Calories | 109 | 5% |
| Protein | 22g | 44% |
| Total Fat | 2.3g | 3% |
| Omega-3s | 115mg | — |
| Omega-6s | 210mg | — |
| Vitamin B12 | 1.6mcg | 67% |
| Selenium | 41mcg | 75% |
| Phosphorus | 170mg | 14% |
| Niacin | 3.9mg | 24% |
Tilapia provides excellent protein (22g) at moderate calories with minimal fat. The omega-6 to omega-3 ratio is higher than fatty fish, a consideration for those specifically optimizing fatty acid balance, though tilapia remains a nutritious lean protein choice.
Lean Fish Comparison
Table 6: Lean Fish Comparison (3 oz cooked)
| Fish | Calories | Protein | Fat | Omega-3s | Best For |
|---|---|---|---|---|---|
| Cod | 70 | 15g | 0.6g | 158mg | Lowest calorie |
| Tilapia | 109 | 22g | 2.3g | 115mg | Highest protein |
| Halibut | 94 | 19g | 1.4g | 395mg | Balance |
| Flounder | 73 | 15g | 0.9g | 253mg | Mild flavor |
| Sea Bass | 82 | 16g | 1.7g | 473mg | Higher omega-3 |
For those following a nutrition plan for prediabetes or similar therapeutic dietary approaches, lean fish provide substantial protein without the caloric density that can complicate blood sugar and weight management.
Tuna Nutrition: America’s Most Consumed Seafood
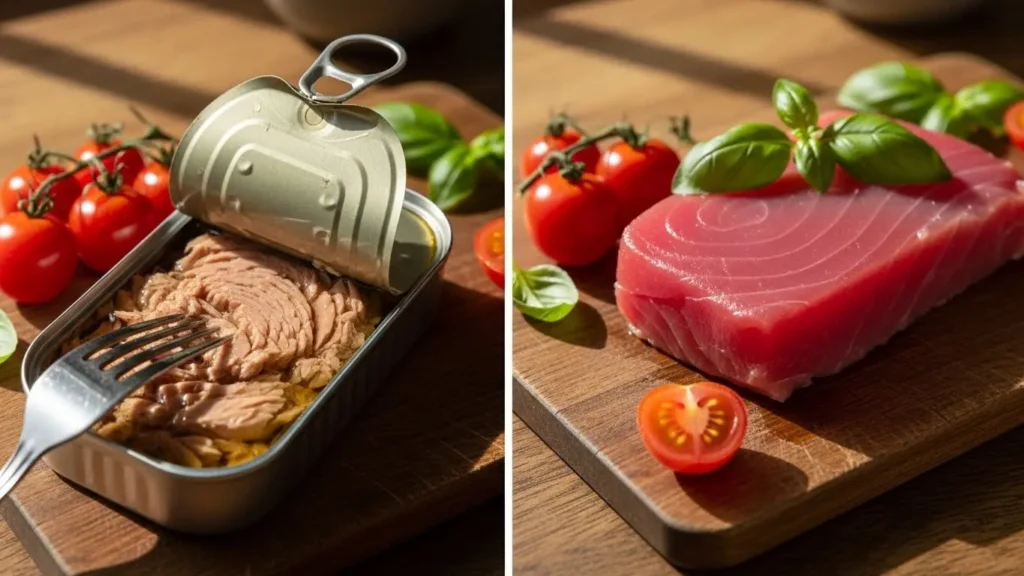
Tuna nutrition deserves dedicated analysis given its dominant position in American seafood consumption—canned tuna represents the most commonly purchased seafood product, while fresh tuna offers distinct nutritional advantages.
Canned Tuna Analysis
Canned light tuna (skipjack) per 3-ounce drained serving:
Table 7: Canned Light Tuna Nutritional Profile (3 oz drained)
| Nutrient | Amount | % Daily Value |
|---|---|---|
| Calories | 73 | 4% |
| Protein | 17g | 34% |
| Total Fat | 0.8g | 1% |
| Omega-3s | 230mg | — |
| Vitamin B12 | 2.5mcg | 104% |
| Selenium | 68mcg | 124% |
| Niacin | 11.3mg | 71% |
| Phosphorus | 139mg | 11% |
| Mercury | ~0.12ppm | — |
Canned albacore (white) tuna provides more omega-3s (733mg per serving) but higher mercury (~0.35ppm), influencing consumption recommendations particularly for pregnant women and children.
Fresh Tuna Comparison
Table 8: Fresh Tuna Varieties Comparison (3 oz cooked)
| Tuna Type | Calories | Protein | Omega-3s | Mercury Level |
|---|---|---|---|---|
| Skipjack | 88 | 19g | 230mg | Low |
| Yellowfin | 93 | 20g | 210mg | Moderate |
| Albacore | 109 | 22g | 733mg | Moderate-High |
| Bluefin | 122 | 20g | 1,140mg | High |
| Bigeye | 92 | 20g | 540mg | High |
Bluefin tuna offers the highest omega-3 content but carries significant mercury concern alongside sustainability issues. For regular consumption, skipjack and yellowfin provide favorable nutrition-to-risk ratios.
Mercury Considerations
Mercury accumulates in predatory fish through biomagnification—larger, longer-lived species concentrate mercury from consuming smaller fish throughout their lifetimes. Understanding this helps navigate tuna choices:
- Low mercury (2-3 servings/week safe): Skipjack (canned light), salmon, sardines
- Moderate mercury (1-2 servings/week): Albacore (canned white), yellowfin
- High mercury (limit consumption): Bigeye, bluefin, king mackerel, swordfish
For populations particularly sensitive to mercury (pregnant women, nursing mothers, young children), emphasizing low-mercury options while limiting high-mercury species supports both nutritional benefit and risk minimization.
Shrimp Nutrition: Low-Calorie Protein Excellence

Shrimp nutrition demonstrates exceptional protein efficiency—substantial protein delivery at minimal caloric cost with unique nutrient contributions including astaxanthin, a powerful carotenoid antioxidant.
Shrimp Analysis
Cooked shrimp per 3-ounce serving:
Table 9: Shrimp Complete Nutritional Profile (3 oz cooked)
| Nutrient | Amount | % Daily Value |
|---|---|---|
| Calories | 84 | 4% |
| Protein | 20g | 40% |
| Total Fat | 0.9g | 1% |
| Omega-3s | 295mg | — |
| Cholesterol | 166mg | 55% |
| Vitamin B12 | 1.4mcg | 58% |
| Selenium | 40mcg | 73% |
| Phosphorus | 201mg | 16% |
| Zinc | 1.4mg | 13% |
| Astaxanthin | ~1.5mg | — |
Shrimp delivers 20g protein at just 84 calories—among the highest protein-to-calorie ratios in the entire food supply. The cholesterol content (166mg) historically concerned consumers, though current research indicates dietary cholesterol minimally affects blood cholesterol for most individuals.
Shellfish Cholesterol Context
The marketing claim that shellfish should be avoided due to cholesterol doesn’t match the food science reality. Dietary cholesterol’s impact on blood cholesterol varies substantially between individuals, with saturated fat demonstrating greater influence for most people. Shrimp contains minimal saturated fat (0.2g per serving), making its overall cardiovascular impact neutral or favorable despite cholesterol content.
For those working with sports & nutrition clients or wholesale nutrition center products, shrimp represents an excellent lean protein option despite outdated cholesterol concerns.
Shellfish Comparison
Table 10: Shellfish Varieties Comparison (3 oz cooked)
| Shellfish | Calories | Protein | Omega-3s | Unique Nutrients |
|---|---|---|---|---|
| Shrimp | 84 | 20g | 295mg | Astaxanthin |
| Crab | 82 | 16g | 375mg | Zinc (highest) |
| Lobster | 76 | 16g | 71mg | Copper |
| Scallops | 94 | 19g | 333mg | B12, magnesium |
| Clams | 126 | 22g | 241mg | Iron, B12 (extreme) |
| Mussels | 146 | 20g | 665mg | Manganese |
| Oysters | 69 | 8g | 585mg | Zinc (exceptional) |
Oysters provide exceptional zinc (74mg per 3-oz serving—673% daily value), making them valuable for immune function and testosterone support. Clams deliver extraordinary B12 (84mcg—3,500% daily value), relevant for those avoiding other animal products or with absorption concerns.
Imitation and Processed Seafood Products
Understanding processed seafood nutrition helps consumers navigate convenience products that may or may not deliver genuine seafood benefits.
Imitation Crab Analysis
Nutritional value imitation crab (surimi) per 3-ounce serving:
Table 11: Imitation Crab Nutritional Profile (3 oz)
| Nutrient | Amount | % Daily Value |
|---|---|---|
| Calories | 81 | 4% |
| Protein | 6g | 12% |
| Carbohydrates | 13g | 5% |
| Sugar | 5g | — |
| Fat | 0.4g | 1% |
| Sodium | 715mg | 31% |
| Omega-3s | ~40mg | — |
Imitation crab is manufactured from processed white fish (typically pollock) combined with starch, sugar, and flavoring. While providing some protein, it delivers fraction of the omega-3s, substantially more sodium, and added carbohydrates compared to real crab. The processing reduces nutritional value while adding ingredients absent from whole seafood.
Real Crab vs. Imitation:
- Real crab: 82 calories, 16g protein, 375mg omega-3s, 911mg sodium
- Imitation crab: 81 calories, 6g protein, ~40mg omega-3s, 715mg sodium
For nutritional purposes, real crab substantially exceeds imitation crab despite similar calorie counts.
Fish Sticks and Breaded Products
Breaded, fried fish products alter the nutritional equation significantly:
Table 12: Breaded vs. Plain Fish Comparison (3 oz)
| Preparation | Calories | Protein | Fat | Omega-3s | Sodium |
|---|---|---|---|---|---|
| Baked Cod | 70 | 15g | 0.6g | 158mg | 66mg |
| Breaded Fish Sticks | 197 | 9g | 10g | 85mg | 340mg |
| Fried Fish Fillet | 229 | 13g | 12g | 120mg | 410mg |
Breading and frying roughly triple calories while reducing protein density, adding substantial fat (often trans fats in commercial preparations), and increasing sodium. The omega-3 content may actually decrease as cooking oil partially replaces fish fat during frying.
Seafood Preparation Effects: Raw, Cooked, Canned, and Smoked
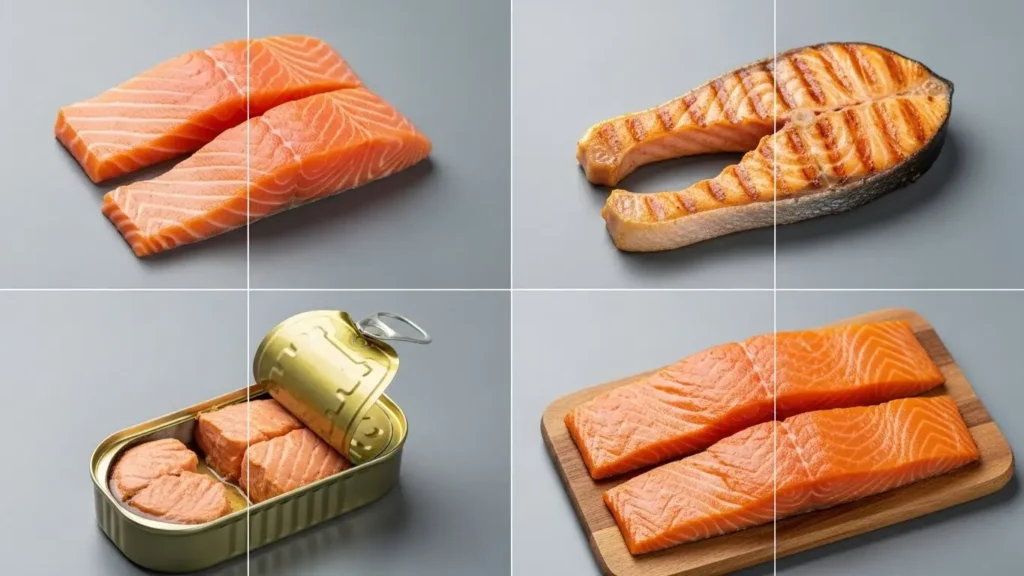
How preparation affects seafood nutrition represents critical knowledge for optimizing dietary intake. Different cooking methods alter nutrient retention, food safety, and practical applications.
Cooking Method Effects
Table 13: Cooking Method Impact on Salmon Nutrition
| Method | Calories | Omega-3 Retention | Protein Retention | Notes |
|---|---|---|---|---|
| Raw (sashimi) | 177 | 100% | 100% | Parasites possible |
| Baked/Roasted | 175 | 90-95% | 100% | Optimal retention |
| Grilled | 175 | 85-90% | 100% | Some fat loss |
| Pan-fried (no oil) | 175 | 85-90% | 100% | Similar to grilling |
| Deep-fried | 230+ | 60-70% | 100% | Oil absorption |
| Poached | 175 | 95% | 100% | Excellent retention |
Baking, roasting, and poaching preserve omega-3 fatty acids most effectively, while deep-frying causes significant nutrient loss alongside substantial calorie addition from oil absorption. The protein content remains stable across cooking methods.
Canned Seafood Considerations
Canning preserves seafood effectively with minimal nutrient degradation:
- Omega-3s: Well-preserved in canned products
- Protein: Fully retained
- Sodium: Often added (check labels for low-sodium options)
- Bones: Softened and edible in canned salmon/sardines, providing calcium
- Convenience: Extended shelf life without freezing
Canned salmon with bones provides 181mg calcium per 3-ounce serving—meaningful contribution from edible softened bones absent in fresh salmon preparations.
Smoked Seafood Analysis
Smoking adds sodium while creating unique flavor compounds:
Smoked salmon (3 oz):
- Calories: 100
- Protein: 16g
- Omega-3s: 380mg
- Sodium: 666mg (vs. 50mg fresh)
The sodium increase (10-15x fresh preparation) makes smoked seafood a consideration for those managing sodium intake, though omega-3 content remains substantial.
Seafood Safety: Mercury, Sustainability, and Quality
Beyond nutrition, seafood selection involves safety and sustainability considerations that affect long-term health and environmental impact.
Mercury Risk Management
Mercury exposure from seafood represents a legitimate concern requiring informed management rather than seafood avoidance:
Table 14: Mercury Levels in Common Seafood
| Category | Species | Mercury (ppm) | Recommendation |
|---|---|---|---|
| Very Low | Salmon, sardines, anchovies, shrimp | <0.1 | 2-3 servings/week |
| Low | Canned light tuna, pollock, catfish | 0.1-0.2 | 2-3 servings/week |
| Moderate | Albacore tuna, halibut, snapper | 0.2-0.4 | 1-2 servings/week |
| High | Bigeye tuna, king mackerel, swordfish | >0.5 | Limit/avoid |
The selenium in seafood provides some protection against mercury toxicity—selenium binds mercury, reducing its harmful effects. Most fish contain selenium-to-mercury ratios favoring protective effects.
Sustainability Considerations
Sustainable seafood choices support long-term ocean health and continued seafood availability:
Generally Sustainable:
- US farmed salmon, arctic char
- US wild-caught Pacific salmon
- US farmed tilapia, catfish
- Farmed mussels, oysters, clams
- Sardines, anchovies
Concerns/Check Source:
- Atlantic cod (some populations recovering)
- Imported shrimp (environmental practices vary)
- Bluefin tuna (severely overfished)
Certifications like Marine Stewardship Council (MSC) for wild-caught and Aquaculture Stewardship Council (ASC) for farmed seafood help identify responsibly sourced options.
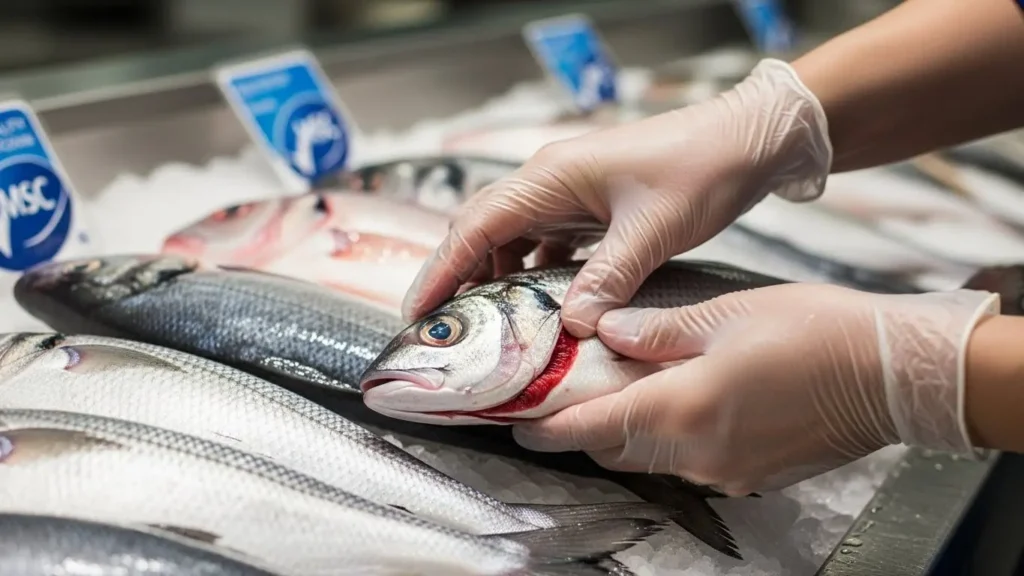
Quality and Freshness Indicators
Fresh seafood quality affects both safety and eating experience:
- Smell: Fresh fish smells mild, oceanic; strong “fishy” odor indicates degradation
- Appearance: Flesh appears moist, springs back when pressed; dull, dried flesh indicates age
- Eyes (whole fish): Clear, bulging eyes indicate freshness; cloudy, sunken eyes suggest age
- Gills: Bright red/pink gills; brown/gray indicates deterioration
Proper storage (32-38°F) maximizes freshness window; consume fresh fish within 1-2 days of purchase.
Seafood Nutrition in Dietary Context
Understanding how seafood nutrition integrates with overall dietary patterns helps optimize food choices across various health goals.
Seafood vs. Other Protein Sources
Table 15: Protein Source Comparison (3 oz cooked)
| Protein Source | Calories | Protein | Omega-3s | Saturated Fat |
|---|---|---|---|---|
| Salmon | 175 | 19g | 1,820mg | 2.1g |
| Chicken Breast | 140 | 26g | 50mg | 0.9g |
| Beef (lean) | 170 | 26g | 40mg | 3.0g |
| Pork Loin | 147 | 23g | 35mg | 1.8g |
| Tofu | 78 | 9g | 0mg | 0.5g |
| Shrimp | 84 | 20g | 295mg | 0.2g |
Seafood’s unique advantage is omega-3 delivery—terrestrial proteins provide minimal omega-3s regardless of other nutritional merits. For comprehensive nutrition, seafood complements rather than replaces other protein sources.
For those exploring dessert nutrition in contrast, comparing nutrient-dense seafood to calorie-dense desserts illuminates vastly different nutritional purposes—one provides essential nutrients, the other primarily sensory pleasure.
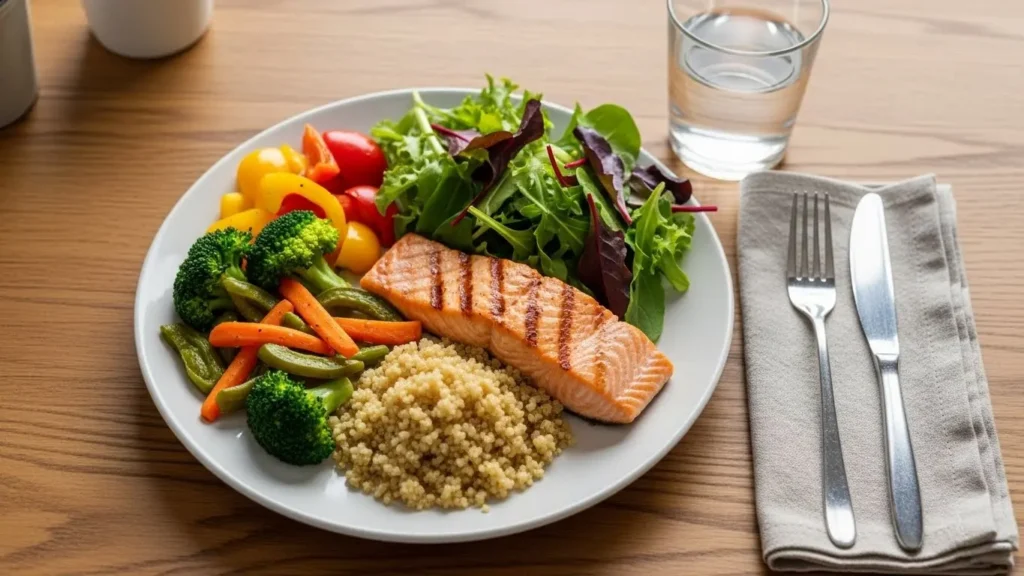
Integration Strategies
Dietary guidelines recommend 8+ ounces of seafood weekly for most adults, emphasizing variety to balance omega-3 intake with mercury exposure management. Practical strategies include:
- Two servings weekly minimum: Meeting basic omega-3 needs
- Variety across species: Balancing fatty and lean fish, low and higher mercury options
- Preparation focus: Emphasizing baking, grilling, poaching over frying
- Canned options: Convenient, affordable ways to increase seafood frequency
For those working at mothers nutritional center locations or similar community nutrition resources, promoting affordable canned seafood helps make omega-3 benefits accessible to budget-conscious consumers.
Special Dietary Applications
Various dietary contexts affect seafood recommendations:
Cardiovascular health: Emphasize fatty fish (2+ servings weekly) for maximum omega-3 benefit; research demonstrates reduced arrhythmia, triglycerides, and cardiovascular mortality.
Pregnancy/lactation: Omega-3s support fetal brain development; emphasize low-mercury options (salmon, sardines, shrimp) while avoiding high-mercury species.
Weight management: Lean fish (cod, tilapia) provide protein density at minimal caloric cost; fatty fish add beneficial fats within reasonable calories.
Brain health: DHA concentrates in brain tissue; regular seafood consumption associates with reduced cognitive decline in aging studies.
For those taking online nutrition courses or pursuing nutrition coaching certification, understanding seafood’s role across therapeutic contexts represents essential applied knowledge.
Comparing Seafood to Alternative Products
Understanding seafood nutrition gains context through comparison with products that might substitute for or claim to replicate seafood benefits.
Seafood vs. Fish Oil Supplements
Whole salmon (3 oz): 1,820mg omega-3s + 19g protein + vitamin D + selenium
Fish oil capsule (1g): ~300mg omega-3s + minimal other nutrients
While supplements provide omega-3s, they lack the complete nutritional package of whole seafood—protein, vitamins, minerals, and potentially synergistic compounds. Research consistently shows stronger health associations with whole fish consumption than supplementation alone, suggesting factors beyond isolated omega-3s contribute to seafood benefits.
Seafood vs. Processed Snacks
Comparing nutrient-dense seafood to processed alternatives reveals stark differences:
Shrimp (3 oz): 84 calories, 20g protein, 295mg omega-3s, brain-supporting nutrients
vs. goldfish nutrition facts/goldfish nutrition label/goldfish nutrition (1 serving crackers): 140 calories, 3g protein, minimal omega-3s, refined carbohydrates
Similarly, examining prime nutrition facts for energy drinks, coke zero nutrition label for diet beverages, or tonic water nutrition info reveals these products provide minimal nutrition compared to whole foods like seafood.
Seafood vs. Other Convenience Foods
Salmon (3 oz): 175 calories, 19g protein, exceptional omega-3s
vs. pillsbury cinnamon rolls nutrition (1 roll): 140 calories, 2g protein, minimal nutrients
Tuna salad (3 oz tuna): ~150 calories, 17g protein, substantial B12
vs. dole whip nutrition/dole whip nutrition facts: 90 calories, 0g protein, minimal nutrients
Grilled fish: Complete protein, essential fats, micronutrients
vs. cpk nutrition facts (restaurant pizza slice): Higher calories, saturated fat, sodium
Even comparing seafood to common toppings reveals nutritional differences: cool whip nutrition facts show primarily air, water, and hydrogenated oils with minimal nutrients, while seafood delivers substantial protein and essential fatty acids.
These comparisons demonstrate seafood’s exceptional nutritional return compared to processed convenience alternatives. For those using nutrition facts creator tools or similar tracking approaches, seafood consistently ranks among the most nutrient-dense choices available.
Breakfast and Snack Context
Comparing seafood nutrition to common breakfast items illuminates opportunities for nutrient density improvement:
Smoked salmon (2 oz): 67 calories, 11g protein, 253mg omega-3s
vs. corn flakes nutrition (1 cup): 100 calories, 2g protein, minimal omega-3s
Sardines on toast: Protein, omega-3s, calcium from bones
vs. ensure plus nutrition label (supplement shake): Engineered nutrients without whole food matrix
For those seeking discount nutrition or discount nutrition superstore options, canned seafood provides affordable access to omega-3s and protein compared to premium supplement products.
Specialized Topics: Aquaculture, Processing, and Emerging Options
Beyond basic nutrition, questions about farming practices, processing methods, and emerging seafood options affect nutritional quality and consumer choices.
Aquaculture Nutrition Considerations
Farmed seafood nutrition depends significantly on feed composition:
- Farmed salmon: Fed fish meal/oil plus plant ingredients; omega-3 content varies by diet
- Farmed tilapia: Often plant-based feed; lower omega-3, higher omega-6 ratios
- Farmed shellfish (mussels, oysters): Filter feeders requiring no feed; nutrition mirrors wild equivalents
Recent aquaculture advances include algae-derived omega-3 feeds, potentially improving farmed fish omega-3 content while reducing pressure on wild fish stocks used for feed.
Novel Seafood Products
The marketplace includes emerging products targeting specific nutritional or convenience needs:
- Seafood nutrition bars: Concentrated fish protein/omega-3s in bar format
- Fish protein powder: Alternative to whey/plant proteins with omega-3 bonus
- Seaweed products: Marine nutrition without fish (iodine, minerals, some omega-3s)
For those interested in revolts nutrition or similar innovative nutrition approaches, these products offer additional ways to incorporate marine nutrition into dietary patterns.
Regional and Specialty Seafood
Regional availability affects practical seafood choices:
- Pacific Northwest: Wild salmon, Dungeness crab, Pacific oysters
- New England: Atlantic cod (recovering), lobster, clams
- Gulf Coast: Gulf shrimp, red snapper, grouper
- Great Lakes: Walleye, lake trout (local omega-3 sources)
Local seafood often provides freshness advantages and supports regional fishing economies, though availability varies seasonally.
Frequently Asked Questions
How much seafood should I eat weekly?
Dietary guidelines recommend 8+ ounces (two servings) of seafood weekly for most adults, with emphasis on variety including both fatty fish (salmon, sardines) and lean fish (cod, tilapia). Higher intakes associate with additional cardiovascular and cognitive benefits without documented harm for most populations, provided high-mercury species are limited.
What fish has the most omega-3 fatty acids?
Atlantic mackerel leads with 2,670mg omega-3s per 3-ounce serving, followed by wild salmon (1,220-1,820mg), herring (1,710mg), bluefin tuna (1,140mg), and sardines (1,260mg). For regular consumption balancing omega-3 content with mercury concerns, salmon and sardines provide optimal risk-benefit profiles.
Is farmed salmon as nutritious as wild salmon?
Farmed salmon typically contains more total fat and omega-3s than wild salmon due to controlled diet and reduced activity. Wild salmon provides more protein per serving and higher vitamin D with lower contaminant exposure. Both options deliver substantial nutritional benefit—the choice involves trade-offs between nutrient profiles, environmental concerns, and price rather than clear nutritional superiority.
Are shrimp high in cholesterol?
Shrimp contains 166mg cholesterol per 3-ounce serving—55% of traditional daily limits. However, current research indicates dietary cholesterol minimally affects blood cholesterol for most individuals, with saturated fat demonstrating greater influence. Shrimp’s minimal saturated fat (0.2g per serving) makes its overall cardiovascular impact neutral or favorable despite cholesterol content.
What seafood should pregnant women eat?
Pregnant women should consume 8-12 ounces of low-mercury seafood weekly for fetal brain development benefits from DHA. Best choices include salmon, sardines, anchovies, shrimp, tilapia, and canned light tuna. Avoid high-mercury species: swordfish, shark, king mackerel, bigeye tuna, and limit albacore tuna to 6 ounces weekly.
Is canned tuna as nutritious as fresh?
Canned tuna retains protein, B vitamins, and selenium effectively. Omega-3 content depends on species and varies by product—check labels for omega-3 information. Canned tuna packed in water provides nutrition closest to fresh; oil-packed versions add calories from packing oil. For most practical purposes, canned tuna delivers comparable core nutrition to fresh at substantially lower cost.
Why does seafood contain mercury?
Mercury enters oceans through industrial pollution and natural sources, where bacteria convert it to methylmercury that accumulates in marine food chains. Larger, longer-lived predatory fish accumulate more mercury through biomagnification—eating smaller fish throughout their lifetimes. Smaller, short-lived species (sardines, anchovies) contain minimal mercury due to limited accumulation time.
How can I afford to eat more seafood?
Budget-friendly seafood strategies include: canned salmon/tuna/sardines (often $2-4 per serving); frozen fish (comparable nutrition to fresh at lower cost); smaller species like sardines and anchovies; sales and warehouse store purchases; and whole fish (lower cost per pound than fillets). Canned seafood provides omega-3 benefits at fraction of fresh fish costs.
Is sushi nutritionally different from cooked fish?
Raw fish (sashimi) retains 100% of omega-3 fatty acids and nutrients—no cooking losses occur. However, sushi rice adds 30-45g carbohydrates per roll, and many American sushi rolls include mayonnaise-based sauces, fried components, and cream cheese that dramatically alter nutritional profiles. Simple sashimi or nigiri provide optimal seafood nutrition; complex rolls may not.
What’s the best fish for weight loss?
Lean white fish provides maximum protein at minimum calories: cod (70 calories/3 oz), tilapia (109 calories), flounder (73 calories). Shrimp offers 20g protein at just 84 calories. Even fatty fish like salmon (175 calories) provides excellent nutrition-to-calorie ratio. For weight loss, any preparation method avoiding breading and frying supports caloric goals while delivering essential nutrients.
Do fish oil supplements replace eating fish?
Fish oil supplements provide omega-3 fatty acids but lack protein, vitamin D, selenium, and other nutrients whole fish delivers. Research shows stronger health associations with whole fish consumption than supplementation, suggesting synergistic factors beyond isolated omega-3s. Supplements may benefit those who cannot eat fish, but whole seafood remains preferable for comprehensive nutrition.
How do I know if fish is fresh?
Fresh fish indicators include: mild oceanic smell (not strong “fishy” odor); moist, translucent flesh that springs back when pressed; clear, bulging eyes in whole fish; bright red or pink gills; and firm texture. Avoid fish with dull appearance, dried surfaces, sunken or cloudy eyes, or ammonia smell. Purchase from reputable sources with high turnover and proper refrigeration.
Conclusion
The comprehensive analysis of seafood nutrition reveals a food category delivering unique nutritional benefits unavailable from terrestrial sources—omega-3 fatty acids at concentrations making seafood essential for EPA and DHA intake, complete protein with exceptional bioavailability, and micronutrients including selenium, vitamin D, and B12 at levels exceeding most other foods. Fish nutrition data consistently demonstrates that 3-ounce servings provide 15-25g high-quality protein alongside 100-2,000mg omega-3 fatty acids depending on species selection.
The practical implications support regular seafood consumption as foundational to optimal nutrition. Meeting the 8+ ounces weekly minimum ensures meaningful omega-3, selenium, and vitamin D intake, while variety across species balances maximum nutrition with mercury exposure management. Fatty fish (salmon, sardines, mackerel) optimize omega-3 delivery; lean fish (cod, tilapia, shrimp) provide protein efficiency at minimal caloric cost.
Understanding preparation effects helps navigate practical choices: baking and poaching preserve nutrients optimally, canned options provide convenience without significant nutrient compromise, and avoiding breaded/fried preparations prevents caloric inflation that undermines seafood’s nutritional advantages.
For those building nutrition knowledge—whether through formal education, professional certification, or personal interest—seafood nutrition represents foundational content essential for dietary counseling. The omega-3 biochemistry, mercury risk management, and species selection principles that apply to seafood extend throughout nutrition practice.
Independent laboratory testing confirms that properly sourced and handled seafood delivers its nutritional content reliably. Unlike some processed products where marketing claims exceed nutritional reality, whole seafood represents straightforward nutrition—measurable, verifiable, and uniquely valuable for essential fatty acids that no terrestrial food can adequately replace.
The evidence overwhelmingly supports making seafood a regular dietary component for most individuals, with attention to species selection, mercury considerations, and sustainable sourcing supporting both personal health and ocean ecosystem preservation.
Medical Disclaimer
This article provides nutritional information for educational purposes only. Individual needs vary based on age, health status, activity level, and medical conditions. Pregnant and nursing women should follow specific seafood guidance regarding mercury exposure. Those with shellfish allergies should avoid relevant species entirely. Consult a registered dietitian or healthcare provider before making significant dietary changes. Data current as of January 2026. Nutritional values may vary based on specific species, origin, and preparation methods.