The JENNIE-O page for its white-turkey patty prints two calorie figures at once: 250 on the Nutrition Facts panel, 200 in the marketing copy a few lines up. Read the panel. Turkey burger nutrition facts shift with the exact product in your freezer, and the printed label settles the number – calories, protein, sodium and fat all move between brands, and here they move between two spots on a single web page.
Turkey burger nutrition facts depend on the exact box. A JENNIE-O white-turkey burger logs 250 calories and 24g protein on a 149g serving; a Butterball Original Seasoned patty logs 250 calories and 27g protein on a 151g serving. Both carry 15g total fat. The servings differ by two grams, so compare them label to label, not gram for gram.
The two branded panels: JENNIE-O (149 g) and Butterball (151 g)
Both numbers below come from the manufacturers’ own declarations. JENNIE-O reports its white-turkey burger against a 149g serving; Butterball reports its Original Seasoned burger against one 151 g patty. Those servings are not equal mass, so a line-by-line read compares consumer servings, not identical gram weights.
On protein, the Original Seasoned patty lists 27g against the white-turkey serving’s 24g – though part of that three-gram edge rides on the slightly heavier 151g serving. Calories and total fat match at 250 calories and 15g.
| Per labeled serving | JENNIE-O (149g) | Butterball (151g patty) |
|---|---|---|
| Calories | 250 calories | 250 calories |
| Total fat | 15g | 15g |
| Saturated fat | 4g | 3g |
| Sodium | – | – |
| Total carbohydrate | 0g | – |
| Protein | 24g | 27g |
| Cholesterol | – | 100mg |
Dashes mark a nutrient the brand’s panel doesn’t publish, not a zero. The white-turkey panel doesn’t post a cholesterol line; the Original Seasoned panel doesn’t post a carbohydrate line. Neither value is assumed here.
Why the same JENNIE-O page lists 200 and 250 calories
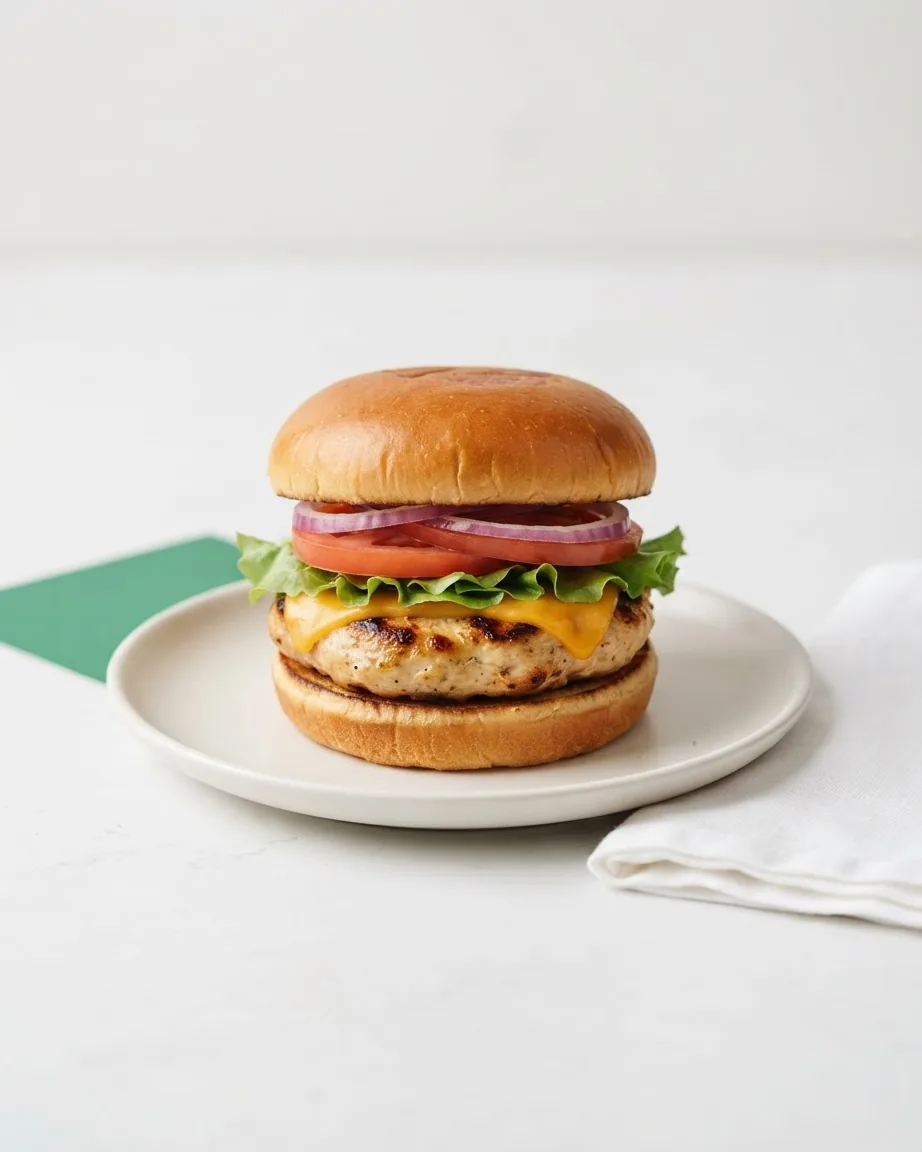
The JENNIE-O product page carries an internal conflict: its descriptive copy says 200 calories per serving while the displayed Nutrition Facts panel says 250 calories. Don’t average them, and don’t quietly take the lower figure.
The resolution is the panel. The brand itself treats current packaging as the most up-to-date product information, so the Nutrition Facts box – 250 calories on a 149g serving – is the figure to carry into your day. The 200-calorie line is copy, and copy lags behind label updates. When a product page shows you two numbers, the panel is the one that has to match the box in your hand.
Reading sodium and saturated fat against FDA Daily Values
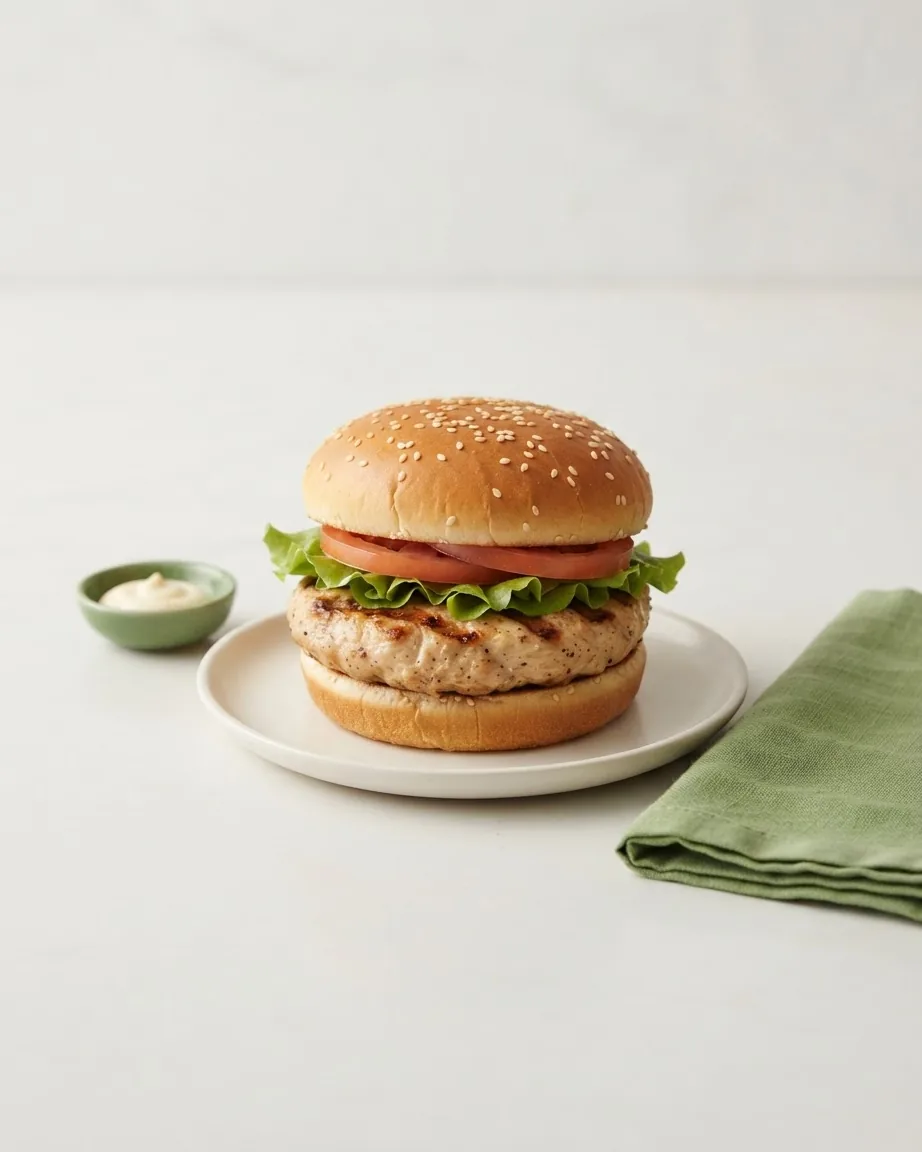
A milligram or gram figure means little alone; the panel gives it a frame in the %DV column. The U.S. Food and Drug Administration sets the Daily Value for sodium at 2300mg and for saturated fat at 20g, then offers two reading marks: 5% DV or less of a nutrient counts as low per serving, and 20% DV or more counts as high.
So when checking that panel’s sodium or saturated fat, read the %DV figure against those 5% and 20% posts rather than judging the raw milligrams. Those marks interpret one labeled serving. They aren’t a personal intake target – your own ceiling can sit above or below the reference the label is built on.
Turkey burger isn’t automatically low-fat: the 15 g line
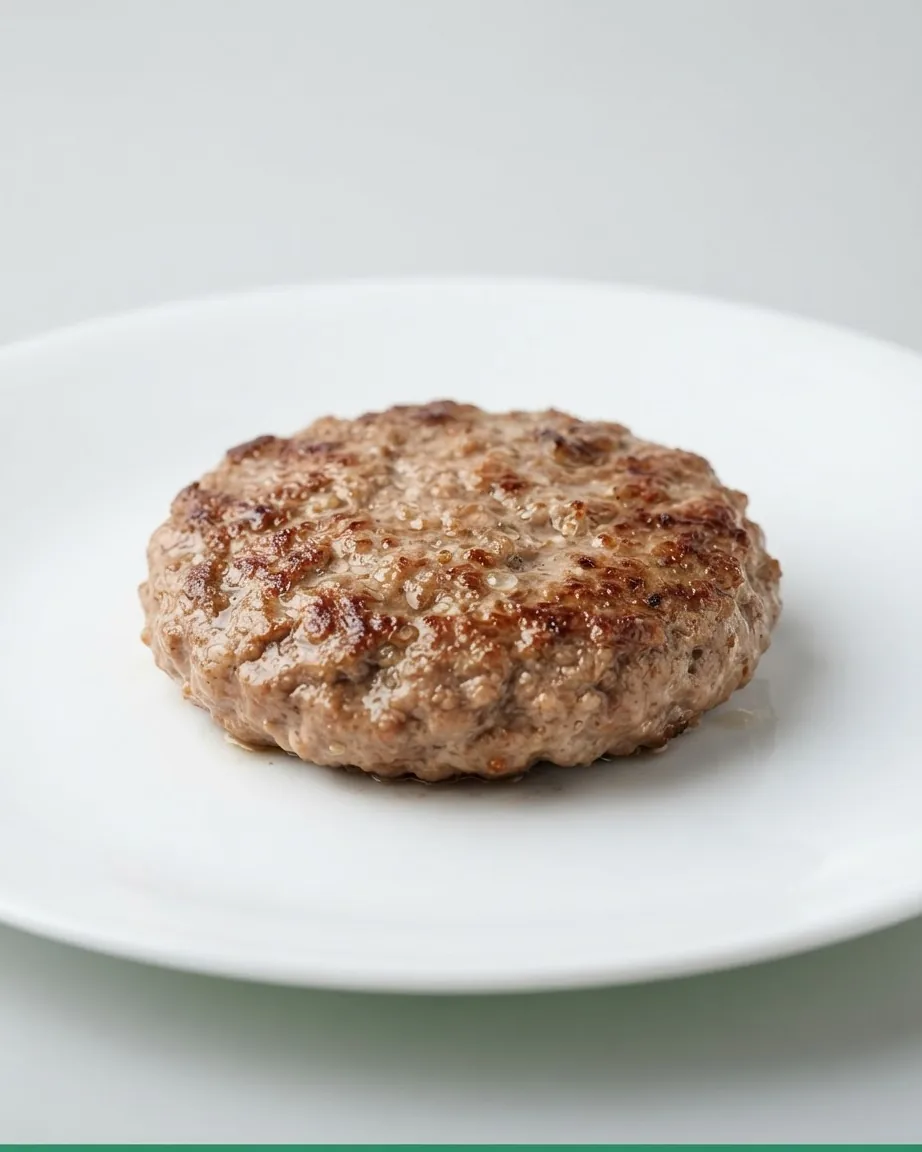
White meat on the front of the box doesn’t erase fat on the back. Both frozen patties carry 15g total fat per serving, with 4g and 3g of that saturated. The carbohydrate side is where turkey keeps things plain – the white-turkey patty logs 0g total carbohydrate – but “turkey” by itself is no guarantee of a lean number. Leaner and fattier grinds and formulations exist, and only the panel on the specific package tells you which one you’re holding.
See also our ground turkey nutrition facts and turkey sausage writeups. Turkey patties are one entry in our wider meat and protein coverage.
Nutrition handled – the cooking step that still stands
Picking the lower-calorie or lower-sodium patty settles the nutrition question, not the safety one. The USDA Food Safety and Inspection Service says ground poultry patties should be cooked to a safe internal temperature. That target holds whichever brand you bought and whichever calorie figure you trusted.
Ground meat spreads any surface bacteria throughout the patty during grinding, so a turkey burger has to hit that internal temperature all the way through. A thermometer in the thickest part is the check; browning on the outside and firmness to the touch both run ahead of a safe center and can mislead you.
Brand panel vs app estimate for a generic turkey burger
Type “turkey burger” into a tracking app and you’ll get a generic average, not your box. That generic entry is often served from a shared database – Nutritionix reports that 20k+ health apps make 250m+ queries to its API every month. A pooled figure built that way smooths over the gap between a 149g JENNIE-O serving and a 151 g Butterball patty.
For the burger you actually cooked, the box wins. Enter the brand’s panel numbers – 250 calories, 24g or 27g protein, 15g fat – rather than the app’s default. The automated average is a fine fallback for an unlabeled homemade patty; it’s the wrong source when a printed label is sitting right there.
Protéines et calories par gramme: l’écart tient-il au produit ou à la portion?
Les deux panneaux affichent 250 calories, mais sur des portions de poids différents (149g contre 151g). Ramener chaque chiffre au gramme sépare ce qui vient du produit de ce qui vient de la taille de portion – un calcul que les deux FAQ de l’article signalent sans le faire.
- Protéines par gramme: JENNIE-O 24 ÷ 149 = 0,161 g/g; Butterball 27 ÷ 151 = 0,179 g/g. L’avance de Butterball survit à la normalisation: environ 1,8 g de protéines de plus pour 100g. L’écart de 3g par portion n’est donc pas un simple effet de portion plus lourde – le produit est réellement plus protéiné au gramme.
- Calories par gramme: JENNIE-O 250 ÷ 149 = 1,68 cal/g; Butterball 250 ÷ 151 = 1,66 cal/g. Les calories « identiques » en portion deviennent légèrement inférieures chez Butterball au gramme, uniquement parce que sa portion pèse 2g de plus. Ici l’égalité affichée est un effet de portion, pas une vraie équivalence.
- Part calorique des protéines: pour les mêmes 250 calories affichées, Butterball en consacre une part plus large aux protéines, puisque sa portion déclare 27g contre 24g.
Conclusion du calcul: l’avantage protéique de Butterball est réel au gramme, alors que l’égalité calorique est un artefact de portions de masses différentes. Pour trancher soi-même, pèse la galette cuite et divise.
Turkey burger nutrition facts FAQ: quick answers
Are the JENNIE-O and Butterball servings the same weight?
No. JENNIE-O measures against 149g, Butterball against a 151 g patty – a two-gram gap. That gap is small, yet it means the listed sodium, protein and fat line up as consumer servings rather than as a strict identical-weight match. Normalizing both to 100 grams would take a separate calculation this guide doesn’t run.
Which patty gives more protein?
The Original Seasoned label reports 27g protein on its 151 g patty, three grams above the 24 grams on the white-turkey 149g serving. Because the two servings weigh slightly different amounts, that protein edge is partly a serving-size effect. If protein per gram matters to you, weigh the cooked patty and divide rather than trusting the per-serving line by itself.
Can I trust the calorie number in a recipe app?
App and database entries for a plain turkey burger are generic averages, pulled from many sources rather than one package. A branded patty carries its own panel, and that panel governs the product you bought. When an app and the box disagree, log the figures printed on the package you actually cooked, not the pooled estimate.
Does a frozen turkey burger still need to reach a safe temperature?
Yes. Freezing pauses bacteria, it doesn’t remove them, so a ground-poultry patty still has to reach a safe internal temperature whether it started frozen or thawed. A thermometer in the center of the patty is the only reliable read; color and firmness both miss undercooked spots in ground meat and can clear a patty that isn’t done.
The takeaway: your box beats the average
Two patties that look alike on a shelf split apart once you read their panels, and one brand’s own page can even split from itself. The move each time is the same: trust the printed Nutrition Facts on the package in front of you over marketing copy, over a tracking app’s generic entry, and over any gram-for-gram shortcut across servings that don’t weigh the same. Then finish the job at the stove. Nutrition is what you log; doneness is what keeps the meal safe, and no calorie figure changes that second step.