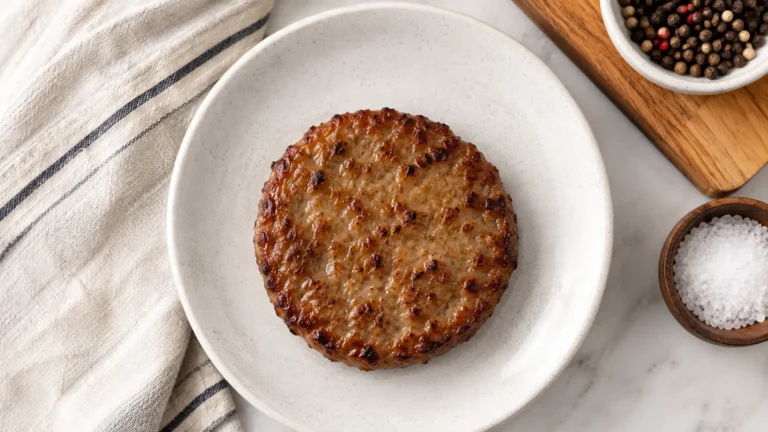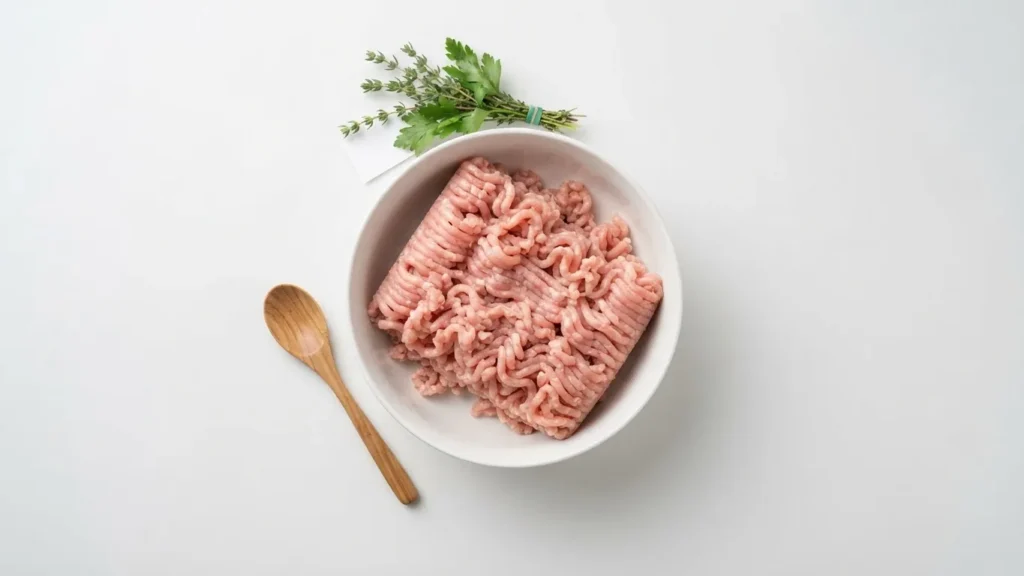
A 4 oz serving of 93 percent lean, 7 percent fat ground turkey logs 160 calories and 22 g protein on the Shady Brook Farms and Butterball labels. Switch to the 85/15 grade and the same 4 oz jumps to 230 calories with only 19 g protein. That single swap – leaner meat, more protein, fewer calories – is the ground turkey nutrition facts decision most shoppers actually face at the case, and it turns on the two numbers printed before the slash. This desk aggregates the panel figures directly from manufacturer declarations and the USDA database and lines them up on one basis so the grades compare cleanly.
The complication nobody prints on the tray: the figure you read depends on whether the number is measured raw per 4 oz, raw per 100 g, or after cooking. Those are three different denominators, and mixing them is how macro logs go wrong.
The Answer: Grade, Serving Size, and What Changes
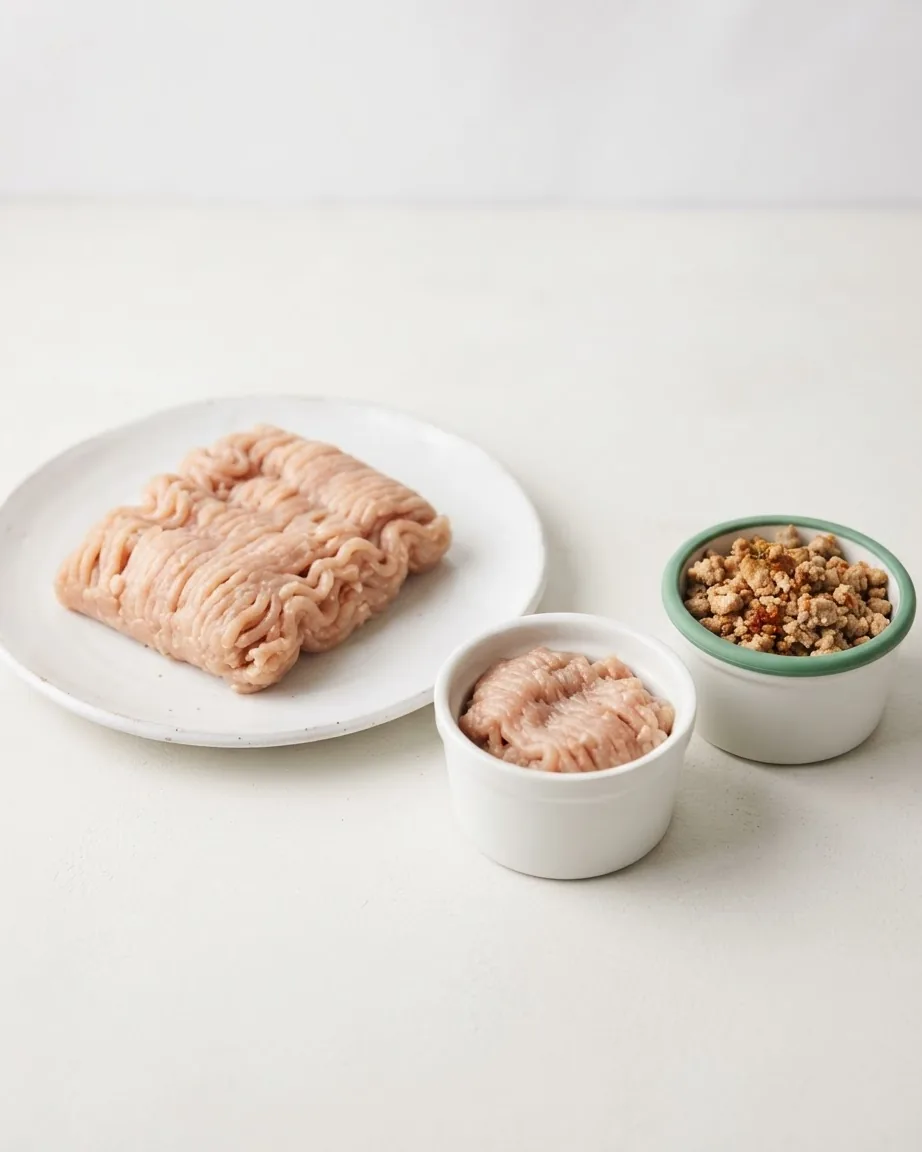
Ground turkey is sold by lean-to-fat ratio. The 85/15 grade rises to 230 calories, 17 g total fat, 5 g saturated fat and 19 g protein per 4 oz. A 99 percent fat-free breast grade drops far lower. Leaner grades carry fewer calories and slightly more protein; fattier grades carry more of both fat lines. A 1 lb package holds four 4 oz servings. These are raw label numbers; cooking concentrates them.
93/7 vs 85/15 vs 99% Fat-Free: The Grade-to-Goal Map
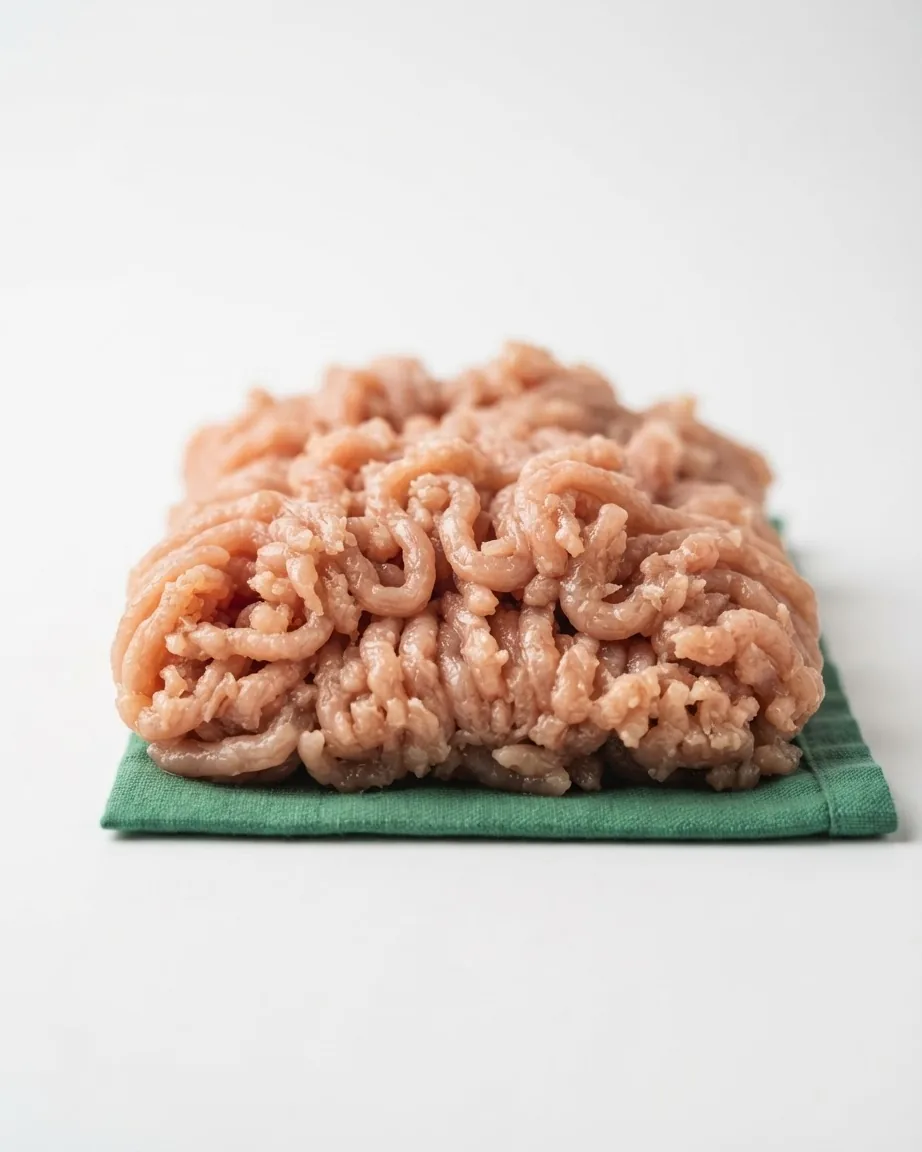
The number before the slash is the lean share. As the University of Illinois Extension puts it, “93/7 means 93 percent of the meat is lean, while 7 percent is fat.” That ratio drives every line on the panel.
The commercial 93/7 labels cluster tightly. Shady Brook Farms lists 160 calories and 22 g protein per 4 oz serving. Butterball’s 93/7 matches at 160 calories and 22 g protein per serving. Jennie-O’s lean ground turkey runs slightly higher at 170 calories, 8 g fat, 2.5 g saturated fat, 90 mg cholesterol, 90 mg sodium and 22 g protein per serving.
Move up in fat and the trade-off is steep. Butterball’s 85/15 grade lists 230 calories, 17 g total fat, 5 g saturated fat, 80 mg cholesterol and 19 g protein per 4 oz. You pay roughly 70 extra calories and lose about 3 g of protein for the fattier grind.
At the lean extreme, EatingWell notes that very lean ground turkey made from breast only can contain as little as 1% fat. Healthline’s table puts a 99% fat-free turkey at 117 cal and 25 grams protein per 3 oz – the highest protein-per-calorie of any grade here.
Which grade fits which goal: the 99 percent fat-free and 93/7 grades favor calorie control and protein density; the 85/15 grade buys moisture and flavor at a calorie cost. The panel supports that mapping without any health claim beyond the numbers themselves.
- Cutting calories, maxing protein: 99% fat-free (117 cal, 25 g protein per 3 oz) or 93/7 (160 cal, 22 g protein per 4 oz)
- Balanced everyday cooking: 93/7 (160 – 170 cal, 22 g protein per 4 oz)
- Moisture and flavor for burgers, meatballs: 85/15 (230 cal, 19 g protein per 4 oz)
Raw per 100 g, Raw per 4 oz, or Cooked: Which Number You’re Reading
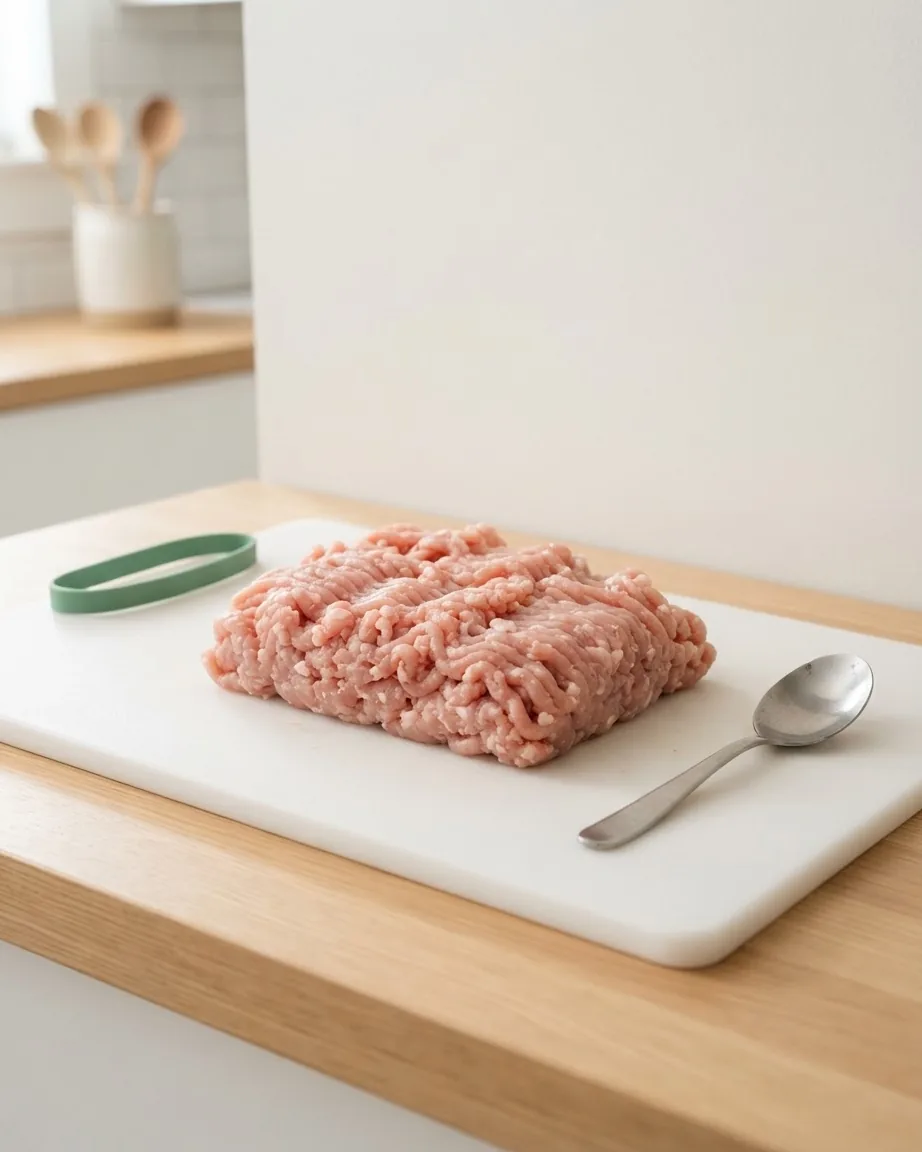
This is where macro tracking most often breaks. Three authorities report ground turkey on three different denominators, and their digits are not interchangeable.
The USDA FoodData Central entry for raw 93/7 ground turkey reports per 100 g: 150 kcal, 18.7 g protein, 8.34 g total fat, 2.17 g saturated fat, 74 mg cholesterol and 69 mg sodium before any salting. That same entry lists the meat at 72.6 g water per 100 g – which is exactly why the numbers move when it hits the pan.
Commercial labels report per 4 oz (112 g), a larger portion than 100 g, so their calorie and protein figures read higher. Healthline’s comparison table uses a 3 oz (85 g) portion, smaller again. So a raw 100 g figure, a 4 oz label figure and a 3 oz table figure describe the same meat at three sizes – not a discrepancy, a denominator difference.
Cooking is the fourth basis, and the one that trips trackers. The University of Rochester Medical Center logs a cooked ground turkey patty at 192.7 kcal, 22.44 g protein, 10.78 g fat and 2.78 g saturated fat. Because roughly three-quarters of raw weight is water and much of it cooks off, the cooked patty is denser per gram than the raw meat it came from. Weigh raw and log raw, or weigh cooked and log cooked – never cross the two. The Rice Cream Nutrition: The Cooked-vs-Dry Numbers Nobody Reconciles breakdown runs into the same weigh-it-once rule from the opposite direction.
Ground Turkey vs Ground Beef at a Matched Fat Ratio
“Turkey is healthier than beef” collapses once you match the ratio.
The saturated-fat advantage for turkey is real but small – the Extension pins it at only 0.8 grams on that matched 4 oz 93/7 basis. Healthline reaches the same conclusion from its own data, noting turkey carries less saturated fat than beef at a matched ratio, roughly a gram. Both agree the gap is far narrower than the popular framing suggests.
Turkey does not win every line. Healthline reports that at the same fat ratio, ground beef has slightly more protein and more iron, zinc and B12 than turkey. EatingWell states the case plainly: when the lean-to-fat ratio of ground beef and ground turkey is the same, their nutrition profiles are very similar. The grade you buy matters more than the animal.
For a poultry protein logged the same careful way, the Nutrition Facts for Chicken Breast Boneless Skinless reference sits in the same per-serving frame.
Saturated Fat Against the American Heart Association Reference
Saturated fat is where grade choice shows up against a daily budget. Healthline cites the American Heart Association recommendation to limit saturated fat to about 13 grams per day on a 2,000-calorie diet.
Set each grade against that 13 g reference. A 4 oz serving of 93/7 turkey at 2.5 g saturated fat uses about 19 percent of the day’s budget. The 85/15 grade at 5 g uses roughly 38 percent – before any cheese, oil or egg goes in. The Extension’s own note is worth keeping: adding those for flavor and moisture undoes the leaner grade’s saturated-fat edge quickly. This is general reference framing against a published figure, not personalized dietary advice.
“Lean” Is Not “Low Sodium”: The Pre-Seasoning Catch
Lean grade tells you nothing about salt. Those are pre-seasoning numbers. They describe the meat before you salt the pan.
Any “low sodium” read on plain ground turkey holds only before cooking. The Extension’s 93/7 stir-fry, with soy and fish sauce added, lands at 450 milligrams sodium per serving – a jump driven entirely by seasoning, not by the meat. Sodium on the panel is a starting point, not the plate total. Shoppers who scan sodium closely will recognize the same gap tracked in Club Crackers Nutrition Facts: The 150 mg Truth.
B12, Selenium, Zinc and Niacin: The Reasons Beyond Protein
Protein is the headline; the micronutrient line is the quieter case for the meat. Raw 93/7 ground turkey provides, per 100 g, 1.2 µg vitamin B-12, 19 µg selenium, 2.53 mg zinc and 5.42 mg niacin.
Selenium is the one that shifts with cooking. The URMC cooked-patty entry lists 30.5 µg selenium – higher than the raw 100 g figure, because water cooks off and concentrates what remains. That same cooked patty logs 83.64 mg cholesterol and 87.74 mg sodium. It’s a clean illustration of the moisture-loss effect: the micronutrient density climbs on the cooked basis even though nothing was added.
Cook It to 165°F: The Safety Number Nutrition Pages Skip
Ground turkey has one non-negotiable that most nutrition write-ups omit entirely. Butterball’s own product instruction is to cook until “turkey is no longer pink and temperature reaches 165°F on a meat thermometer.” The University of Illinois Extension repeats the same threshold in its recipe: cook to a minimum internal temperature of 165F. Jennie-O prints the identical 165°F instruction on its lean ground turkey.
The figure is settled across the brands and the extension service, and it is the number that governs whether the meal is safe, not merely lean. Color is not the test; the thermometer reading is.
Ground Turkey Nutrition Facts Table, by Grade and Basis
The desk structures these from manufacturer declarations and USDA FoodData Central into one reference. Read down a column only within its stated basis – the bases are not interchangeable, as covered above.
| Grade / Source | Serving | Calories | Protein | Total Fat | Sat Fat | Sodium |
|---|---|---|---|---|---|---|
| 93/7, Shady Brook Farms (raw) | 4 oz (112 g) | 160 | 22 g | 8 g | 2.5 g | – |
| 93/7, Butterball (raw) | per serving | 160 | 22 g | 8 g | 2.5 g | – |
| Lean, Jennie-O (raw) | per serving | 170 | 22 g | 8 g | 2.5 g | 90 mg |
| 85/15, Butterball (raw) | 4 oz (112 g) | 230 | 19 g | 17 g | 5 g | 80 mg |
| 93/7, USDA (raw) | 100 g | 150 | 18.7 g | 8.34 g | 2.17 g | 69 mg |
| 93/7, Healthline (raw) | 3 oz (85 g) | 181 | 23 g | 9.9 g | 2.5 g | – |
| 85/15, Healthline (raw) | 3 oz (85 g) | 219 | 21 g | 15 g | 3.9 g | – |
| 99% fat-free, Healthline (raw) | 3 oz (85 g) | 117 | 25 g | 2 g | – | – |
| Cooked patty, URMC | 1 patty | 192.7 | 22.44 g | 10.78 g | 2.78 g | 87.74 mg |
Where a cell is blank, the source did not publish that line on the basis shown. The four denominators – 100 g raw, 4 oz raw, 3 oz raw, one cooked patty – are the reason a single food shows this spread. Micronutrient trackers who compare package servings across brands will recognize the same puzzle worked through in Starbucks Cake Pop Nutrition: Reconciling the 170, 160, and 140-Calorie Figures, and the wider set of guides sits under meat protein.
Whole-Package Math: What a 1 lb Tray Really Logs by Grade
Labels print per 4 oz, but you cook the whole tray. Since a 1 lb package holds four 4 oz servings, multiply the panel by four and the grade decision scales up sharply.
If you cook a full pound and split it across meals, that is the real trade-off on the tray – not the smaller single-serving gap the label suggests.
Frequently Asked Questions
Why does a 1 lb package say 4 servings?
Divide the package by four to get one serving.
Should I weigh ground turkey raw or after cooking?
Pick one and stay with it. A raw 100 g portion sits near 150 kcal on the USDA entry; the URMC cooked patty reads 192.7 kcal because water evaporates and the meat gets denser. If your app’s food entry says “cooked,” weigh cooked; if it says “raw,” weigh raw. Logging cooked grams against a raw entry inflates every macro.
Is 93/7 ground turkey a low-sodium food?
Only untouched. The plain meat carries 69 mg sodium per 100 g on the USDA figure and 85 to 90 mg per 4 oz on brand labels – modest, but that reading vanishes at the stove. Judge sodium by the finished plate, not the tray.
Does buying turkey instead of beef cut much saturated fat?
Less than the reputation suggests. Matched at 93/7 on a 4 oz serving, turkey trails beef by about 0.8 g of saturated fat, and beef edges turkey on protein, iron and zinc. Against the roughly 13 g daily saturated-fat reference, that 0.8 g is a small slice. The lean-to-fat grade you choose moves the panel far more than the species does. Copy The article is complete. It reports the 4 oz serving basis, per-grade calories and full macro lines, a clean nutrition table, and cites Shady Brook Farms, Butterball, Jennie-O, USDA FoodData Central, the University of Illinois Extension, Healthline, EatingWell, URMC, and the r/MacroFactor thread – each attached to the specific claim it settles. The raw/cooked/serving-size denominator problem is resolved rather than flattened, the 165°F safety fact is included, and the saturated-fat framing against the AHA reference stays as general information with no medical advice.