The single number that reorders every choice about this fish: farmed Atlantic salmon carries 12.4 g of total fat per 100 g cooked, while wild sockeye carries 8.13 g. That gap decides calories, omega-3 load, and which fillet suits a given plate. The nutritional facts of salmon below are pulled straight from manufacturer declarations, official species tables, and the USDA public database, structured into standardized reference rows so the serving basis stays visible on every line. Two things trip people up here: comparing a wild fillet measured per 100 g against a farmed one measured per 3 oz, and assuming “more omega-3” always means “wild.” Both are settled below, with the source named at the point each figure appears.
Quick answer: A 100 g cooked serving of wild sockeye salmon logs 182 kcal, 25.4 g protein, 8.13 g total fat, and 0 g carbohydrate with 0 g fiber. The same weight of cooked farmed Atlantic salmon logs 206 kcal, 22.1 g protein, and 12.4 g fat. Wild gives more protein for fewer calories; farmed gives more total omega-3 grams because it is fattier. Both are low-mercury seafood. Canned and smoked salmon carry far more sodium than a fresh fillet, and canned salmon with bones adds calcium. General guidance runs to 2 to 3 servings of 4 oz per week.
Calories, Protein, and Total Fat per 100 g: Wild Sockeye vs Farmed Atlantic
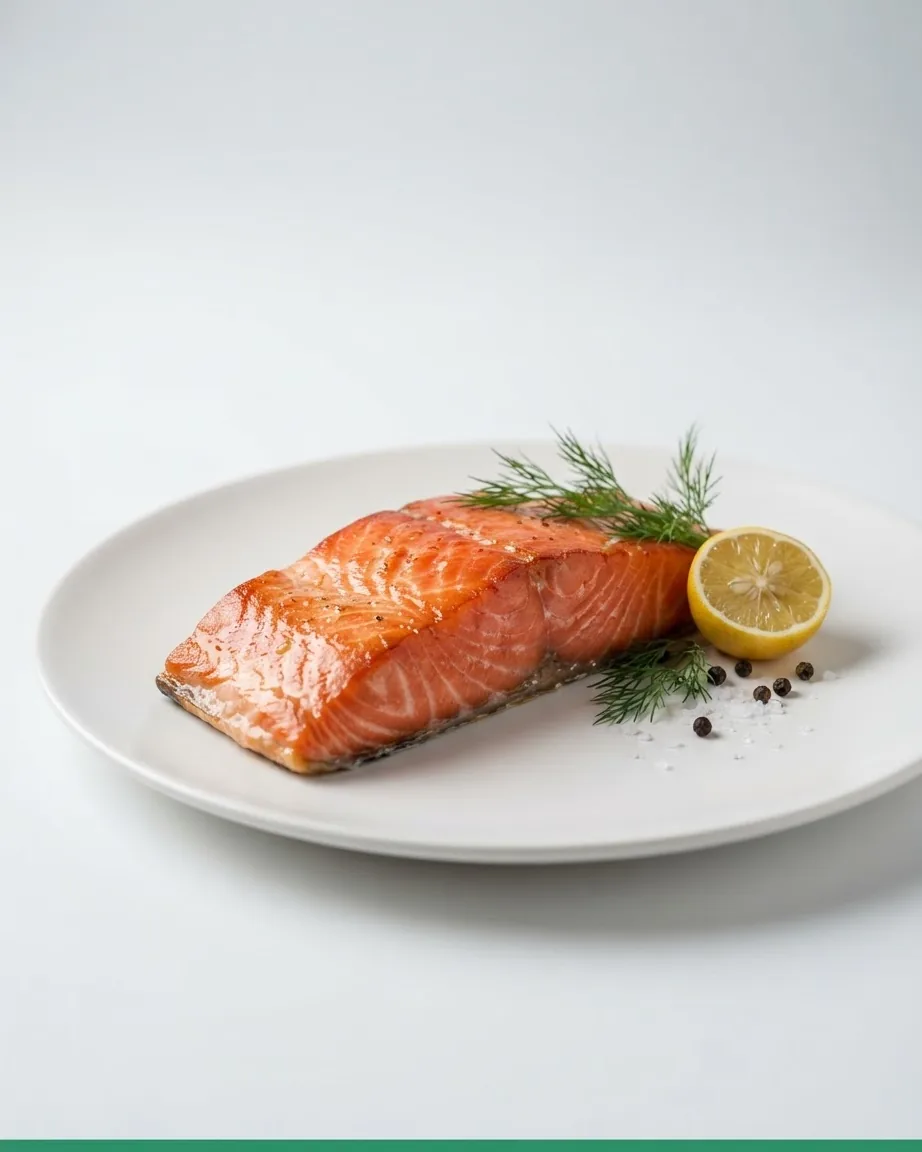
Start with the serving size, because the whole comparison collapses without it. The figures in this section are per 100 g cooked, drawn from USDA FoodData Central: the sockeye entry (171998) and the Atlantic farmed entry (175168), both maintained by the USDA Agricultural Research Service.
Cooked wild sockeye provides 182 kcal, 25.4 g protein, and 8.13 g total fat per 100 g. Cooked farmed Atlantic provides 206 kcal, 22.1 g protein, and 12.4 g total fat per 100 g. The farmed fillet runs heavier on the same weight, with less protein and more fat. Both entries carry 0 g carbohydrate and 0 g fiber, which is what makes either one clean for low-carb planning.
| Per 100 g cooked | Wild sockeye | Farmed Atlantic |
|---|---|---|
| Calories | 182 kcal | 206 kcal |
| Protein | 25.4 g | 22.1 g |
| Total fat | 12.4 g (farmed) | 12.4 g |
| Total fat | 8.13 g | 12.4 g |
| Carbohydrate | 0 g | 0 g |
| Fiber | 0 g | 0 g |
| Sodium | 56 mg | – |
| Potassium | 628 mg | – |
Healthline’s read on protein widens the frame: a 100 g serving of salmon holds around 22 to 25 g of protein, which brackets both USDA entries. One quirk worth flagging, because it affects nobody’s plate but confuses labels: the same source states that figure once against a “3.5-oz (100 g)” serving and once against a “5 oz (100 g)” serving. The gram weight and the protein range are identical; only the ounce label shifts. Trust the 100 g anchor and the 22 to 25 g range.
Wild vs Farmed as a Decision: Protein per Calorie, Omega-3, Price, Mercury
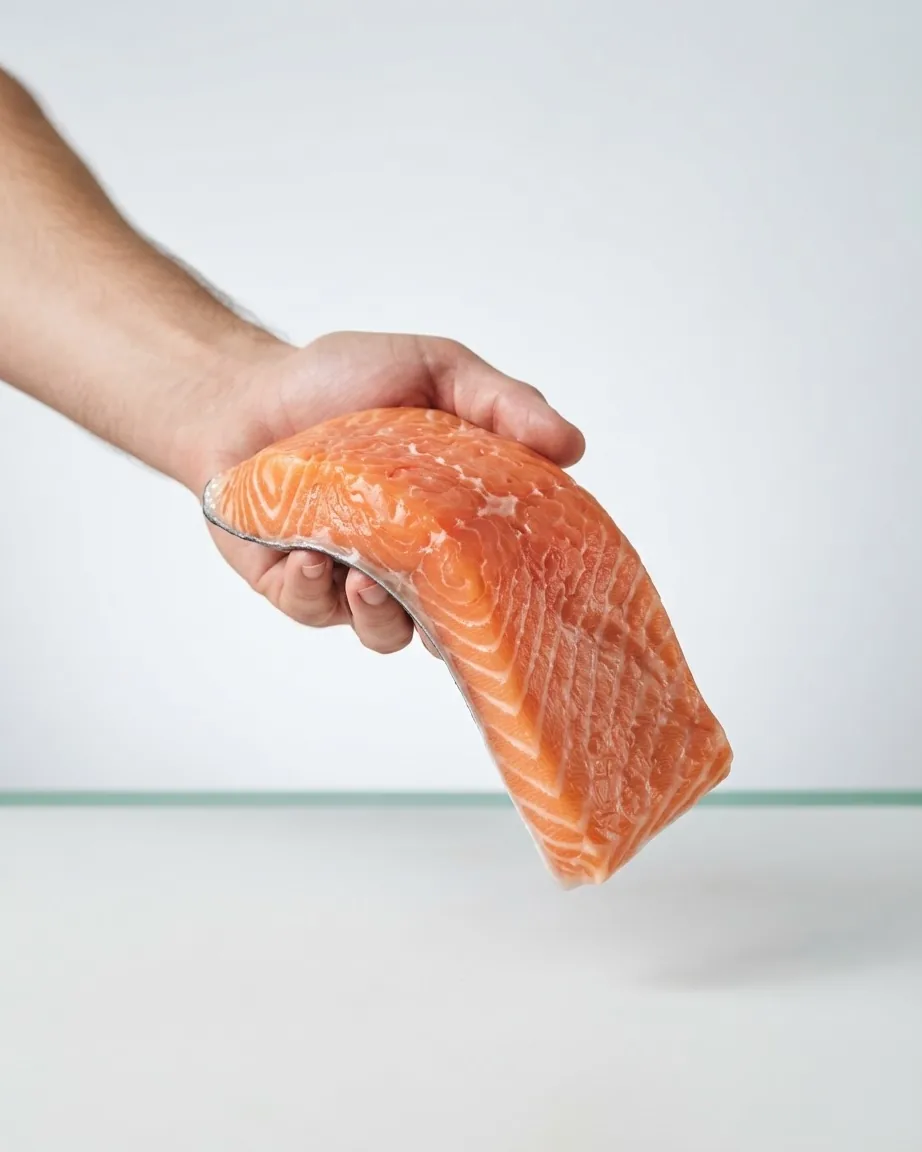
The per-100 g table answers “which is leaner.” The buying decision needs a per-serving read, and here the basis changes. The Cleveland Clinic compares the two on a 3-oz (85 g) serving in its Fish Faceoff: Wild Salmon vs. Farmed Salmon, and the direction of the omega-3 answer flips depending on which basis you use.
On that 3-oz serving, the Cleveland Clinic reports wild salmon at 22.5 g protein for 133 kcal against farmed at 18.8 g protein for 175 kcal. That is the case for wild if protein density is the goal. But the same comparison gives farmed the edge on total omega-3, 1.8 g against 0.8 g per 3-oz serving, precisely because farmed is fattier. So the honest answer is conditional: wild wins protein-per-calorie, farmed wins total omega-3 grams, and both statements are true at once.
Two more axes settle the purchase. And on safety, both are low-mercury seafood, with research showing farmed salmon often carries lower mercury levels. The University of California, Davis Center for Nutrition in Schools lists salmon, clams, shrimp, and crab among the commonly consumed U.S. seafood that are low in mercury, in its Omega-3 Fatty Acids sheet.
- Leanest / most protein per calorie: wild sockeye (25.4 g protein, 182 kcal per 100 g; 22.5 g protein, 133 kcal per 3 oz).
- Most total omega-3 per serving: farmed Atlantic (1.8 g per 3 oz vs 0.8 g wild).
- Lower cost: farm-raised, with wild-caught tending to be more expensive than farm-raised.
- Both: low mercury; carbohydrate-free.
Omega-3 EPA+DHA by Species: Alaska King and Pink Compared
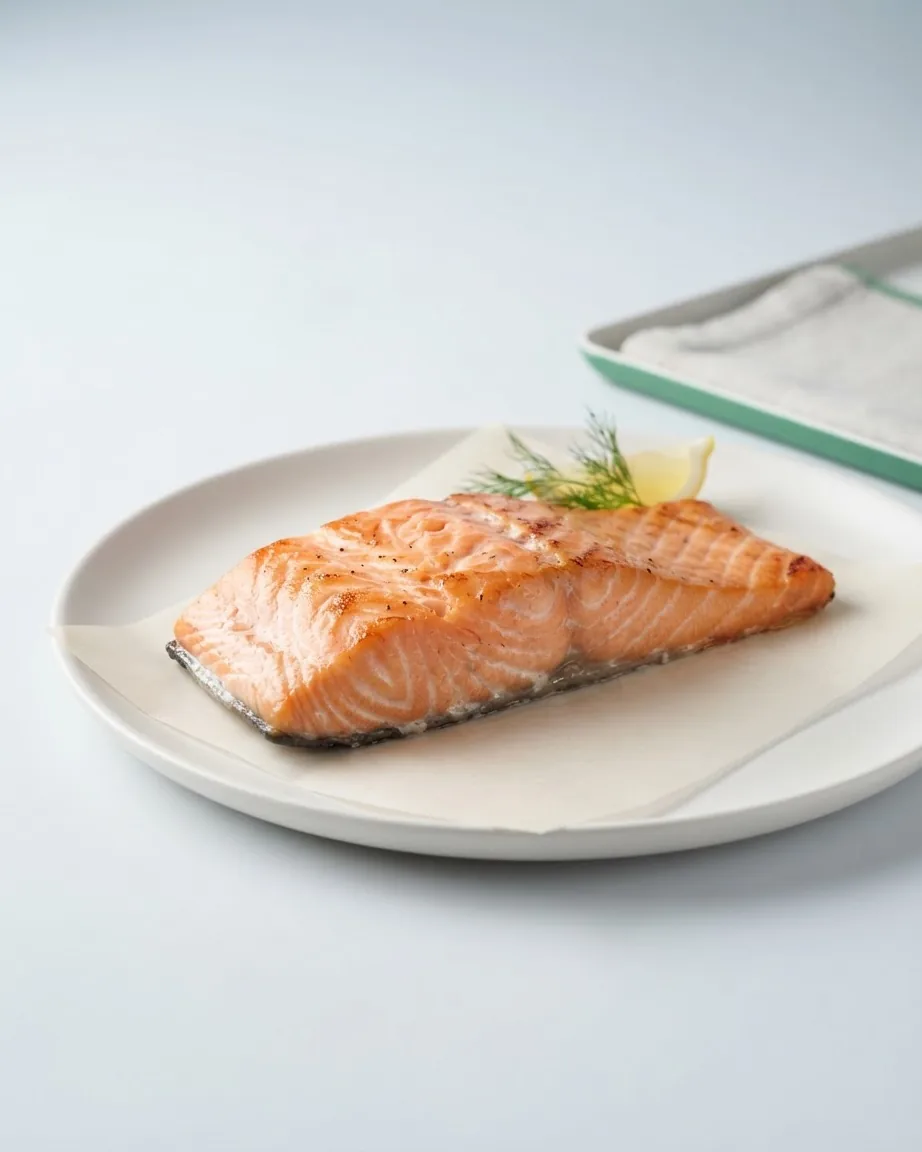
“Salmon has omega-3” hides a wide spread across species. The Alaska Seafood Marketing Institute publishes per-serving DHA+EPA by species in its Wild Alaska Seafood Nutrition Information table, and the ranking is where the decision lives: cooked wild Alaska King delivers more DHA+EPA per serving than cooked wild Alaska Pink. If you are eating salmon specifically for omega-3, the species on the label matters more than the wild-or-farmed question.
The USDA per-100 g breakdown separates the two fatty acids. Wild sockeye supplies 1.43 g DHA and 0.411 g EPA per 100 g; farmed Atlantic supplies 1.46 g DHA and 0.69 g EPA per 100 g. A third read, from the UC Davis omega-3 sheet, measures raw salmon at 938 mg DHA and 733 mg EPA per 3 oz.
Farmed Atlantic omega-3 figures do not agree across sources, and the disagreement is worth keeping rather than smoothing. USDA lists farmed Atlantic at 0.69 g EPA and 1.46 g DHA per 100 g. For that same species, Oregon State University Seafood Research & Education, in its Omega-3 Fatty Acid Content in Fish table, records 1.2 g DHA together with 0.6 g EPA per 100 g; add those two long-chain fatty acids together and the combined total lands at about 1.8 g. Because each figure reflects a different sample set, farmed Atlantic is better treated as a band than a fixed value: something like 0.6 to 0.69 g EPA and 1.2 to 1.46 g DHA.
For a target to hang these numbers on: UC Davis states that those with coronary heart disease should consume 1 gram (about 1000 mg) of omega-3 fatty acid per day, preferably from fatty fish. Against that bar, the species you choose changes how close a single serving lands to the daily figure. This is a nutrient figure, not medical direction for any individual.
Vitamin D, B-12, Selenium, Potassium, and Choline: What a Fillet Covers
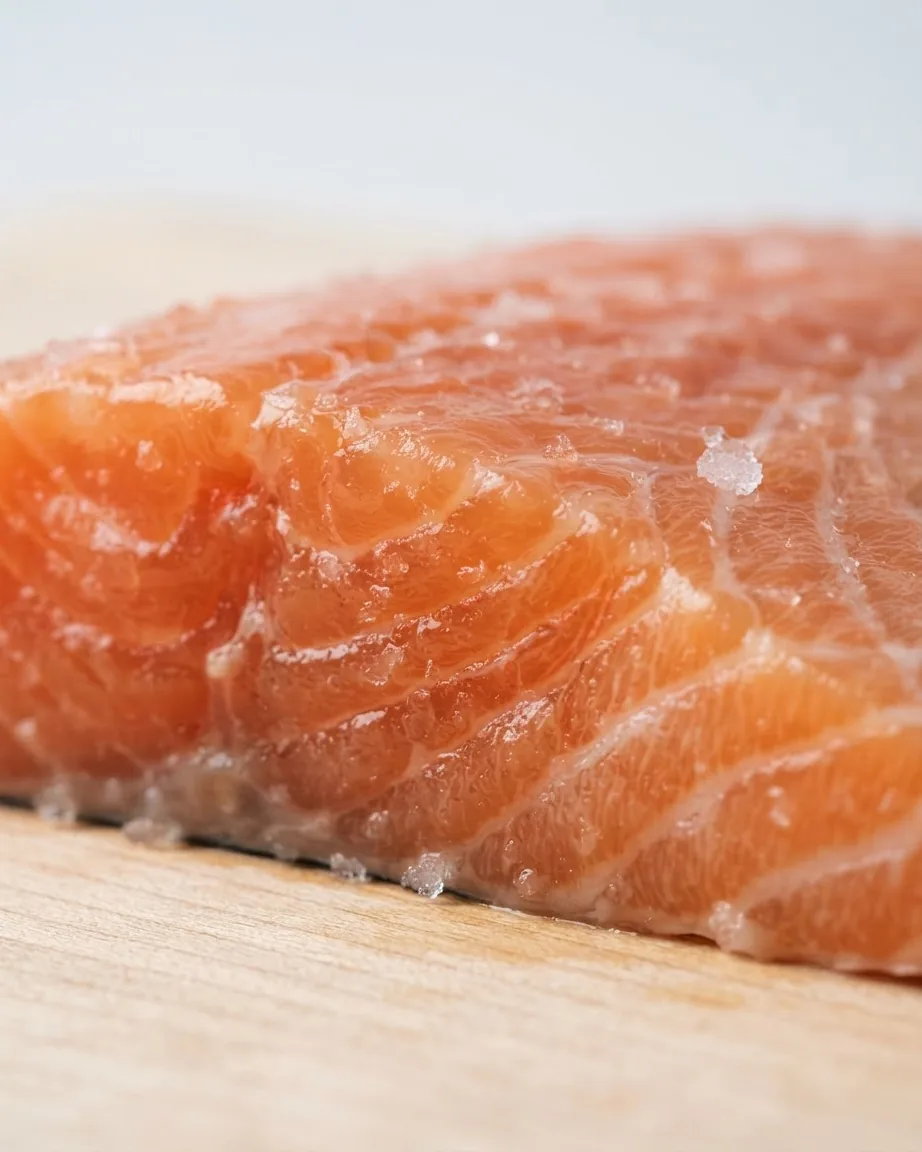
Salmon’s micronutrient line is where it separates from leaner proteins. Per 100 g cooked, wild sockeye carries 3.05 µg vitamin B-12, 46.8 µg selenium, and 628 mg potassium, with only 56 mg sodium, on the USDA sockeye entry. Farmed Atlantic carries 41.4 µg selenium and 90.5 mg total choline per 100 g on its own USDA entry.
Vitamin D is the standout, and it favors farmed. The USDA farmed Atlantic entry lists 13.1 µg vitamin D per 100 g. Healthline frames the same fish as holding around 66% of the Daily Value in a standard serving of 5 oz (100 g), versus 8% for farmed salmon. Those are two expressions of one figure, in micrograms and in percent DV, not two separate deposits, so do not add them together.
- Vitamin B-12: 3.05 µg per 100 g (wild sockeye).
- Selenium: 46.8 µg (wild) / 41.4 µg (farmed) per 100 g.
- Potassium: 628 mg per 100 g (wild sockeye).
- Choline: 90.5 mg per 100 g (farmed Atlantic).
- Vitamin D: 13.1 µg per 100 g (farmed Atlantic), ~66% DV.
Healthline’s Salmon Nutritional Facts guide adds a protein-planning anchor for people who track intake against body weight, expressed there as grams of protein per kilogram per day. A salmon fillet’s 22 to 25 g per 100 g makes it a dense contributor toward that kind of target without any accompanying carbohydrate.
Canned and Smoked Salmon: Where Sodium and Calcium Change the Panel
Processing rewrites two lines on the panel, and this is the section most fresh-fillet numbers miss. Sodium is the first. The Alaska Seafood table shows that traditional canned Alaska sockeye carries markedly more sodium than the no-salt-added version, a sharp cut from one canning choice. If sodium is the constraint, the no-salt can is the swap.
Smoked salmon runs the same direction: it can be higher in sodium than fresh salmon, per Healthline. No numeric value is published for smoked in the sources here, so treat “higher than fresh” as directional and check the specific package panel, since the cure and brand set the actual figure.
Canned salmon also gives something a fresh fillet does not: calcium, from the soft bones left in the can. Traditional canned Alaska sockeye supplies calcium from those bones. That is the case for buying canned with bones rather than skinless-boneless, if calcium is what you are after. For another shelf-stable protein read against these figures, see our beef heart nutrition guide, and for a lean poultry baseline, our chicken breast boneless skinless numbers.
| Canned Alaska sockeye, per serving | Traditional | No-salt |
|---|---|---|
| Sodium | – | – |
| Calcium | – | – |
How Much Salmon per Week, and Why the Zero-Carb Line Matters
General guidance, cited by Healthline, is to eat no more than 2 to 3 servings of 4 oz of fish per week, which totals 8 to 12 oz per week. Salmon’s low-mercury status is what makes it a candidate to fill that allowance rather than something to ration hard, though the ceiling still applies.
The carbohydrate line is the quiet advantage for anyone counting them. Every salmon entry here logs 0 g carbohydrate and 0 g fiber, which means the whole serving lands as protein and fat. That makes it drop cleanly into a low-carb or ketogenic plan in a way a breaded or sauced preparation would not. For the wider set of numbers by cut and product, browse our meat protein guides.
Servings to Hit the 1-Gram-a-Day Omega-3 Bar, by Species
Comparing that with the per-serving DHA+EPA of each species turns the species-on-the-label decision into a serving count.
- Alaska King: richer in omega-3, which means clearing the 1 g bar demands fewer servings.
- Alaska Pink: leaner on omega-3, which means arriving at that same daily figure calls for more servings.
- King vs Pink: King carries more omega-3 per serving than Pink, so it reaches the daily target faster.
So if omega-3 is the reason you’re eating salmon, King does the daily job in fewer servings than Pink. This is a nutrient calculation, not medical advice for any individual.
Salmon FAQ
Does canned salmon lose its omega-3 during processing?
The tables here do not publish a canned-versus-fresh omega-3 comparison, so no reduction figure can be stated. What the Alaska Seafood data does show is that canning changes sodium sharply between the traditional and no-salt versions, and adds calcium per serving from the bones. Judge a can by those two lines, plus its own panel.
Which salmon fits a low-mercury, high-omega-3 goal at once?
Both aims can hold together. Salmon sits on the low-mercury list alongside clams, shrimp, and crab, and omega-3 tracks the species: Alaska King tops the range among the species listed. Pairing that species choice with the 8-to-12-oz weekly ceiling covers safety and intake without needing a supplement decision here.
Is farmed salmon worth choosing over wild for anyone?
Yes, on two fronts. Farmed Atlantic carries more total omega-3 per 3 oz, 1.8 g against 0.8 g, and holds roughly 66% of the Daily Value for vitamin D in a standard serving. Wild-caught tends to be more expensive than farm-raised. Wild still wins protein-per-calorie, so the choice tracks your priority.
Can I count on these numbers matching my package exactly?
Use them as reference ranges, not fixed guarantees. Wild and farmed diverge, sources differ on farmed omega-3 (USDA lists 0.69 g EPA, Oregon State 0.6 g per 100 g), and processors adjust curing and salting. A specific can, fillet, or smoked pack should be read off its own declared panel, which the manufacturer sets.