Drafted with AI language models. How this page was made
A half-cup of corn can carry 15 mg of sodium or it can carry 320 mg: same vegetable, same volume, same label category, yet the gap is more than twentyfold depending on which can leaves the shelf. That one spread settles most of what matters about canned corn nutrition: the macros barely move between products, but sodium swings from near-zero to nearly a third of an at-risk daily cap in a single serving. Everything below reads off the manufacturer panels and public USDA data, organized into reference tables so the sodium line, the carb line, and the micronutrients each sit where a reader can act on them.
Which can you reach for decides more than anything you do at the sink afterward.
What one serving of canned corn delivers
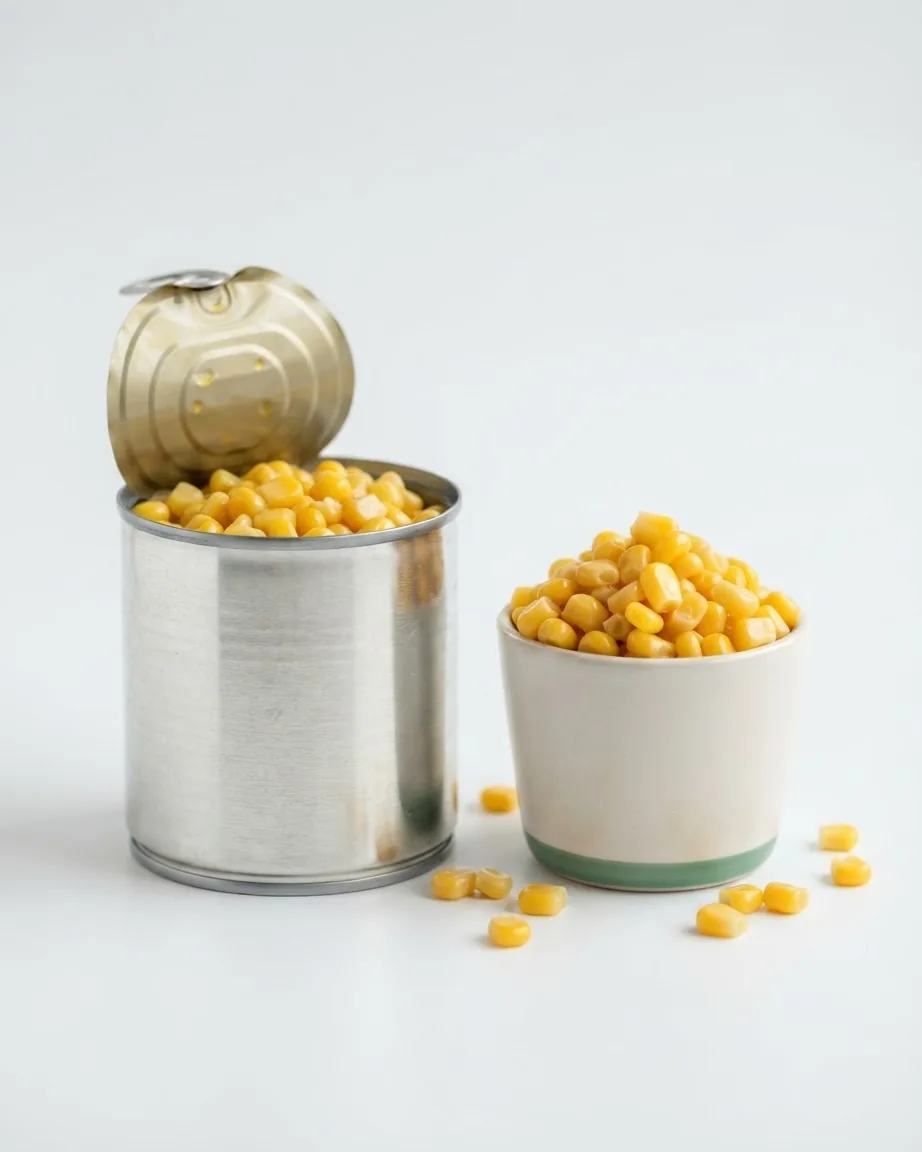
The quick answer. Regular canned sweet corn runs about 70 calories per half-cup with 12 g carbohydrate, 2 g fiber, and 2 g protein, and 320 mg sodium on a standard label. A no-salt-added commodity pack holds 80 calories and 17 g total carbohydrate per half-cup at just 15 mg sodium. Measured per full cup drained, the same food lands near 132.84 kcal, 30.49 g carbohydrate, 3.28 g fiber, and 4.3 g protein. The calorie and carb figures hold steady across brands; sodium is the number that moves, so pick the can by its sodium line.
Two serving bases are in play, and mixing them is where confusion starts. Brand panels and the USDA commodity sheet report against a 1/2 cup (125g) portion. The per-cup profile published by the University of Rochester Medical Center from USDA nutrient data runs against a full drained cup, which is why its sodium reads 350.96 mg: roughly double a half-cup label, not a contradiction of it.
Per half-cup, Green Giant’s regular whole-kernel sweet corn lists 70 calories, 12 g carbohydrate, 2 g fiber, 5 g total sugars, and 2 g protein, per the manufacturer label. The full-cup drained view from the University of Rochester Medical Center adds the micronutrient detail a front panel skips: 319.8 mg potassium, 80.36 mcg total folate, and 1,687.56 mcg lutein plus zeaxanthin.
Canned corn nutrition facts table
| Item | Value |
|---|---|
| Per 1/2 cup, regular (Green Giant) | 70 cal, 12 g carb, 2 g fiber, 5 g sugars, 2 g protein, 320 mg sodium (14% DV). |
| Per 1/2 cup, no-salt-added (USDA commodity) | 80 cal, 17 g carb, 2 g fiber, 2 g total fat, 15 mg sodium. |
| Per 1/2 cup, low-sodium (Green Giant) | 130 mg sodium (6% DV). |
| Per 1 cup drained (USDA data, URMC) | 132.84 kcal, 30.49 g carb, 3.28 g fiber, 4.3 g protein, 350.96 mg sodium, 319.8 mg potassium. |
The commodity figures come from the USDA Food and Nutrition Service fact sheet, which describes the product as “U.S. Grade B whole kernel corn that is canned with no added salt.” For the wider aisle, see our pantry basics section.
The sodium ladder across the aisle
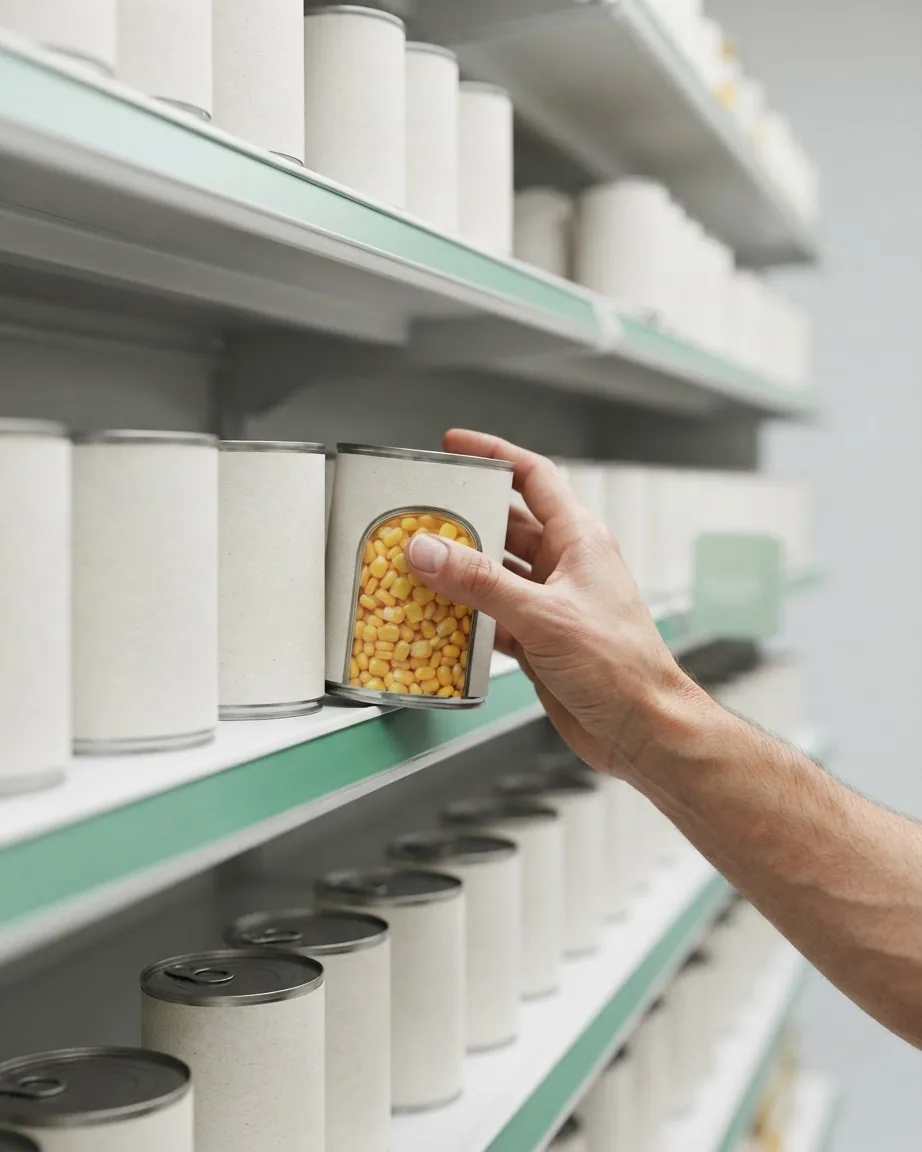
Sodium is the only line where the can you choose changes the math. The products line up so the jump is visible:
| Item | Value |
|---|---|
| No-salt-added commodity corn | 15 mg per 1/2 cup. |
| Green Giant Low Sodium | 130 mg per 1/2 cup, 6% DV. |
| Green Giant / Del Monte regular | 320 mg per 1/2 cup, 14% DV. |
Choosing no-salt-added over a regular 320 mg can removes more sodium in one shelf decision than any rinsing routine reaches. Green Giant publishes both a regular whole-kernel label and a low-sodium version; Del Monte’s standard Golden Sweet panel matches the regular 320 mg figure.
Against a reference, those numbers resolve. The Dietary Guidelines cap sodium at no more than 2,300 mg per day for healthy adults and 1,500 mg per day for at-risk individuals. A low-sodium half-cup at 130 mg spends under 9 percent of the stricter cap; a regular half-cup at 320 mg spends more than a fifth of it before anything else on the plate. For a reader watching blood pressure, that is the line to read first on the panel.
What draining and rinsing canned corn actually removes

The habit of rinsing to cut salt helps, but far less than the aisle choice above. A corn-specific analysis from the USDA Agricultural Research Service (Haytowitz, Nutrient Data Laboratory) traced the numbers directly: sodium in corn “went from 205 mg/100 g (total can contents) to 185 mg/100 g (10%) on draining and to 162 mg/100 g (12%) on rinsing.” In that study, draining alone cut sodium by 9 percent and a further rinse removed about 12 percent more.
Read on the analytical per-100g basis, that is a drop from 205 mg to 185 mg after draining, then to 162 mg after a rinse: a real reduction, but one that leaves most of the salt in a regular can still in the corn. The same ARS page carries other fragments at different values (a 231 mg per 100 g reading at 7 percent, and a “current mean label claim of 279 mg/100 g”); those are context-stripped and may describe different vegetables or preparation states, so they are not reconciled here.
Rinsing is not free. The ARS work recorded vitamin C falling about 5 percent on draining and another 18 percent on rinsing. For corn that loss carries little weight, since its vitamin C is not a nutritionally significant source to begin with. The practical reading: rinse if you already bought a regular can, but buy no-salt-added or low-sodium if sodium is the goal, because the shelf does more than the colander.
One competing figure deserves a flag. A widely circulated claim about draining and rinsing reductions is not tied specifically to corn and was not verified against a corn measurement. On the corn-specific question, the ARS study is the number to trust.
Potassium, folate, and the lutein corn keeps through the can
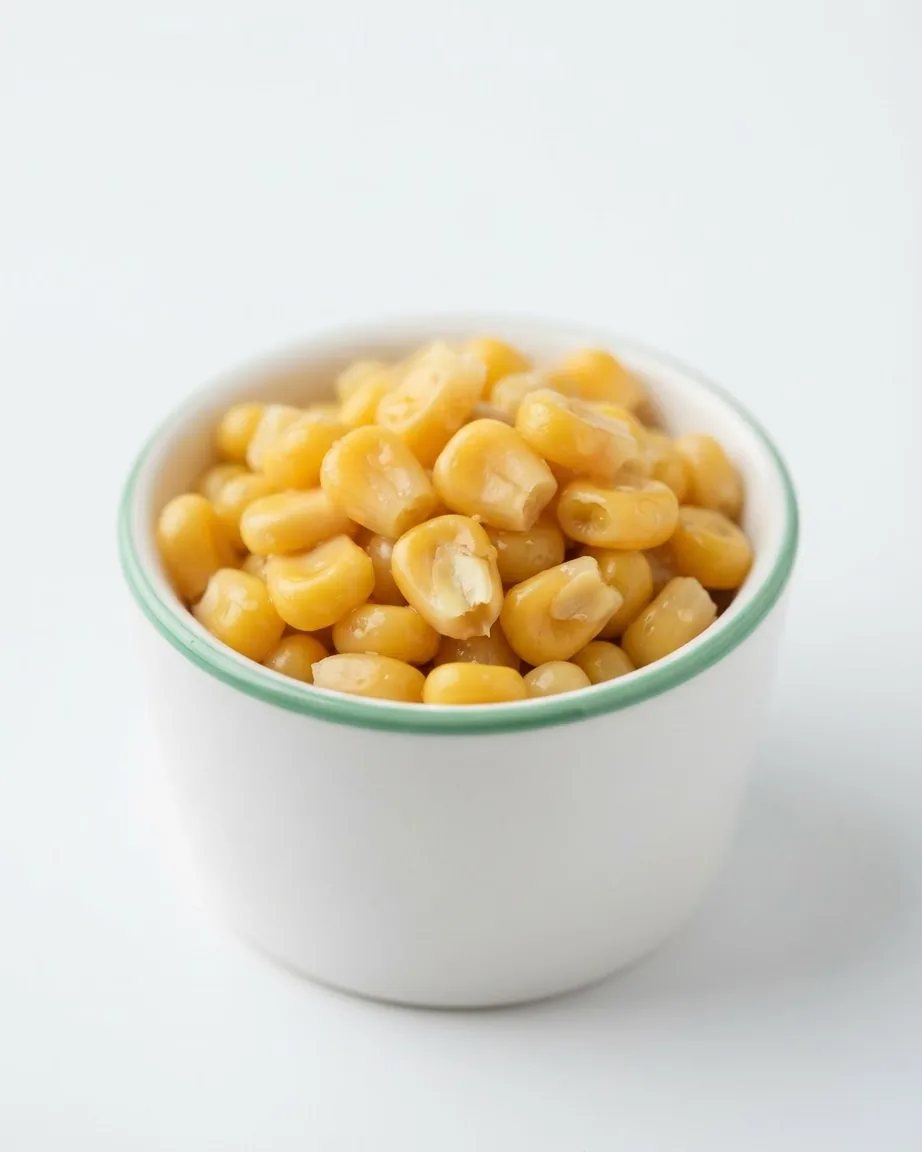
Canning’s heat lowers water-soluble B and C vitamins, so canned corn is not the vitamin-C food fresh corn is. What survives the heat is the part worth buying the can for. Per full drained cup, the USDA profile published by the University of Rochester Medical Center lists 1,687.56 mcg of lutein plus zeaxanthin (the two carotenoids concentrated in the retina), and 80.36 mcg of total folate, both heat-stable enough to carry through processing.
Potassium lands at 319.8 mg per cup on the same drained basis. That reframes the canned-versus-fresh question as a tradeoff rather than a downgrade: you lose some of the delicate vitamins to heat, but the carotenoids and folate stay. A dietitian-reviewed overview at GoodRx Health, whose author Karen Hovav, MD, FAAP, has “more than 15 years of experience as an attending pediatrician,” covers the same benefit-and-caution balance for corn.
Corn is a starch, not a free vegetable
The carb line is why portion matters for anyone managing blood sugar. A half-cup of no-salt-added corn carries 17 g total carbohydrate, and a full drained cup runs 30.49 g: closer to a starchy side than to a leafy green. The 3.28 g of fiber per cup takes some edge off, but corn still belongs in the starch column when a plate is being counted, alongside potato or rice rather than alongside broccoli.
For a reader with diabetes or prediabetes, that means a measured half-cup rather than an open ladle, and pairing it with protein or fat on the plate. This is a framing point, not dietary advice: anyone managing blood sugar should set portions with their own clinician. For other starchy pantry picks read against their panels, see our baked beans guide and the navy beans one cup breakdown.
The whole-can mistake and the kernels-in-stool worry
The failure mode is treating a single-serve can as one serving of the vegetable. Eating a whole single-serve can in one sitting multiplies the sodium several times over the half-cup label number, so the “it’s just corn” assumption breaks against the portion on the label.
The other common worry is the opposite of a nutrition loss. Kernels that appear whole in stool are not undigested food going to waste: the tough outer hull is cellulose that passes through intact, while the starchy interior and its nutrients are broken down and absorbed on the way. Seeing the hulls is normal and is not a sign the corn passed through unused.
Label number vs. lab number: why panels read higher
A reader comparing the brand panel to a database value will find two different sodium figures for what looks like the same corn, and both are correct for what they measure. Brand labels declare 320 mg per 125g half-cup. The ARS analytical mean for total can contents sits near 205 mg per 100 g, and that page notes a “current mean label claim of 279 mg/100 g” running above measured values.
Treat the two as separate data types rather than a conflict. A label figure is the declared, regulated number a manufacturer prints; an analytical figure is what a lab measured in sampled cans, and it can run lower. When the goal is a purchasing decision, read the label number, because that is the one printed on the can in your cart. When the goal is understanding typical content, the analytical figure describes the batch. Panels and formulas can also change without notice, so the number on today’s can is the one that governs.
The Sodium Math: What Each Can Choice Costs You
Every milligram of sodium in canned corn is decided before you reach the sink. Running the numbers already on the panels shows exactly how much each shelf decision moves, and why portion size is the trap most people miss.
- No-salt-added vs. regular, per 1/2 cup: switching from a 320 mg regular can to a 15 mg no-salt-added can removes 305 mg of sodium in a single shelf choice (the regular can carries about 21 times more sodium for the same half-cup).
- Low-sodium vs. regular, per 1/2 cup: choosing the 130 mg low-sodium label instead of the 320 mg regular one cuts sodium per serving, no rinsing required.
- The whole-can trap: a single-serve can eaten whole packs several half-cup servings of sodium. Eating it whole instead of stopping at one 1/2-cup serving adds sodium you did not plan for.
The arithmetic confirms the article’s point: which can you pick off the shelf, and whether you treat a single-serve can as one serving, moves far more sodium than anything you do after opening it.
Frequently asked questions
Is canned corn nutrition worse than fresh?
Not across the board. High processing heat trims water-soluble B and C vitamins, but the drained kernels still hold 1,687.56 mcg lutein plus zeaxanthin and 80.36 mcg folate per cup, both heat-stable. Canned corn also keeps 319.8 mg potassium per cup. The honest summary is a swap of some delicate vitamins for convenience, not a nutritional collapse.
How much sodium does rinsing canned corn remove?
Modestly. The ARS corn measurement shows draining cutting roughly 9 percent and a rinse removing about 12 percent more, dropping from 205 mg toward 162 mg per 100 g. A rinse also sheds about 18 percent of vitamin C, which barely matters for corn. Buying a 15 mg no-salt can beats any colander step.
Which canned corn has the least sodium?
No-salt-added commodity packs at 15 mg per half-cup, far below low-sodium at 130 mg and regular at 320 mg. Portion discipline and the no-salt label win on this measure, since eating a whole single-serve can stacks several half-cup servings of sodium at once.
Can I eat canned corn with diabetes?
Treat it as a starch. A full drained cup carries 30.49 g carbohydrate and a half-cup near 17 g, so a counted portion rather than a free scoop is the usual approach. The 3.28 g fiber helps a little. Portion targets belong with a clinician, not a label.
Why do corn kernels show up whole in stool?
The hull is cellulose the body cannot break down, so it exits looking intact. The starch, protein, and micronutrients inside each kernel are digested and absorbed normally. Visible hulls signal roughage doing its job, not lost nutrition: a point worth remembering before assuming the corn passed through untouched.