
Two cereals can both say “one cup” on the panel and put very different weights of food in your bowl. A cup of dense biscuit cereal and a cup of plain puffed grain are not the same serving, and the Nutrition Facts panel is built around that gap. Reading cereal nutrition facts well comes down to three moves: find the weight behind the serving, read the added-sugars line against its Daily Value, and ignore the front-of-box health framing until the sugar number confirms or kills it. This guide works each of those from the official panels and public food databases.
Quick answer: On a Nutrition Facts panel, cereal serving size follows a weight rule, not a guess: puffed cereal under 20 g per cup logs at 15 g, standard flakes and rounds at 40 g, dense biscuit types at 60 g. The one number that decides whether a cereal is a sugar bomb is added sugars: 5% of the Daily Value or less per serving is low, 20% or more is high, with the Daily Value set at 50 grams per day. Total sugars has no Daily Value. Added sugars, fiber, and protein are where everyday brands split hardest.
Why “one cup” on the panel is three different weights
The serving size on a cereal box is not a portion recommendation. It is set to reflect what people typically eat, and for ready-to-eat cereal it is anchored to a weight band based on how dense the cereal is. The U.S. Food and Drug Administration calls this a Reference Amount Customarily Consumed, and the bands live in federal regulation.
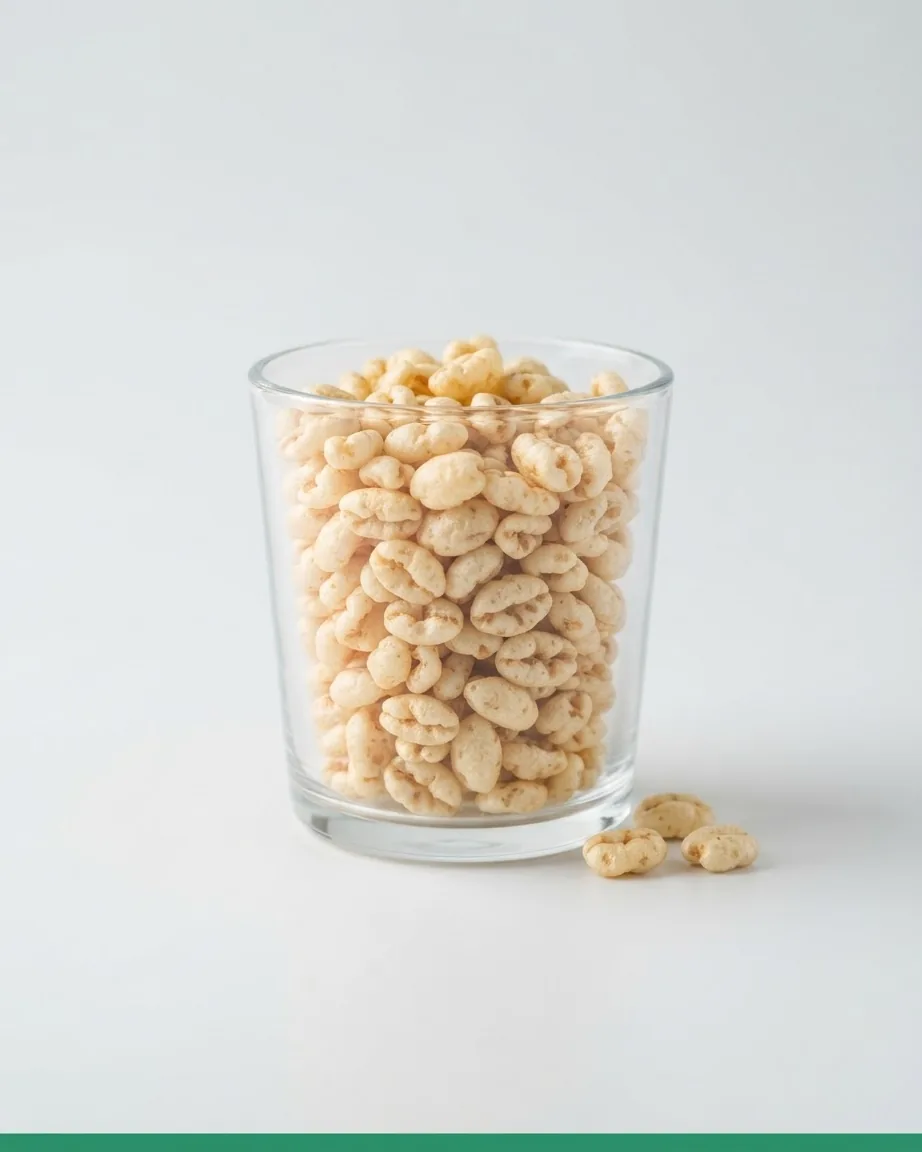
The Office of the Federal Register / eCFR lists three tiers for ready-to-eat cereal. Plain puffed cereals weighing less than 20 g per cup use a reference amount of 15 g. Standard flakes and rounds weighing 20 g or more but less than 43 g per cup use 40 g. Dense biscuit-type cereals weighing 43 g or more per cup use 60 g. High-fiber cereals carrying 28 g or more of fiber per 100 g also fall into the 40 g tier.
The practical consequence: a “cup” of airy puffed cereal and a “cup” of granola-dense clusters report against different gram weights, so their calorie and sugar lines are not comparable cup-to-cup. Check the gram figure in parentheses next to the serving before you compare two boxes. Those reference amounts cover people 4 years and older; a separate, smaller set applies to foods specially formulated for infants and children under 4, and only to those foods.
Reading the added sugars line without getting fooled

The sugar section of a panel has two lines doing different jobs. Total Sugars counts every sugar in the food, whether it came from the grain, from fruit folded in, or from a sweetener added in manufacturing. Added Sugars breaks out only the sweeteners put in. The U.S. Food and Drug Administration notes that Total Sugars carries no Daily Value, while Added Sugars does.
That Daily Value is 50 grams per day on a 2,000-calorie diet. It is the yardstick behind the percent you see on the panel. The FDA uses 5% of the Daily Value or less per serving as the mark for a low source of added sugars, and 20% or more as high. For reference, the agency’s own worked example puts 7 g of added sugars at 14% of the Daily Value.
Harvard T.H. Chan School of Public Health (The Nutrition Source) turns that into a shopping rule: choose cereals with 5% of the Daily Value or less of added sugars and add fruit for sweetness instead. The two-number screen that settles most cereal choices: added sugars low, fiber high. Everything on the front of the box is noise until those two lines check out. For the wider shelf, see our pantry basics section.
Three added-sugar ceilings that do not mean the same thing
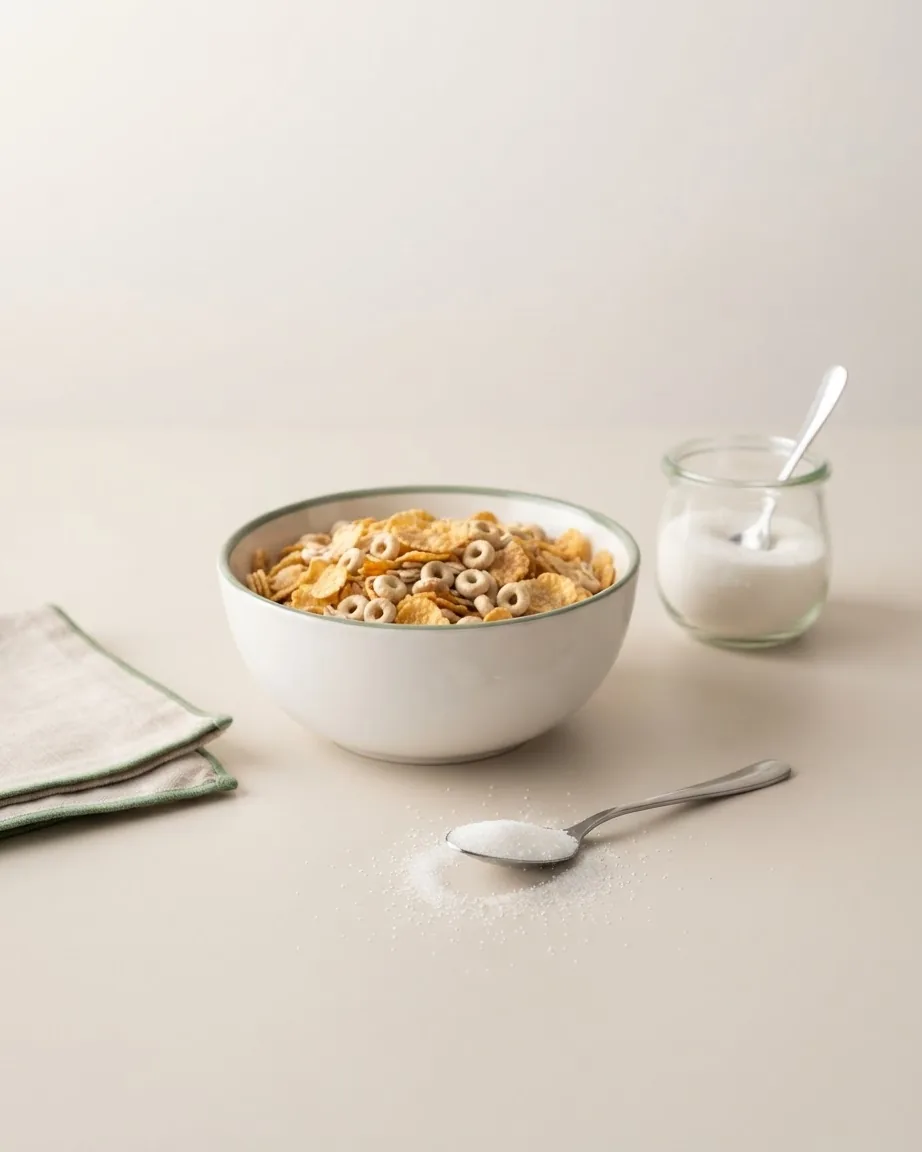
Three authorities publish an added-sugar limit, and readers often blend them into one number. They should not be blended, because each uses a different base.
- The label Daily Value is a single fixed reference: 50 grams per day on a 2,000-calorie diet. It is what drives the percent column, not a personal target.
- The American Heart Association gives sex-specific ceilings: no more than about 6 teaspoons (100 calories) of added sugar daily for most women, and no more than 9 teaspoons for most men. There are four calories in one gram of sugar.
- The Dietary Guidelines for Americans frame the limit as less than 10 percent of total calories per day, which scales with how much you eat overall.
Converted to grams – and counting four grams of sugar as one teaspoon – the AHA ceilings work out to roughly 24 grams for most adult women and 36 grams for most men. The label’s 50 grams is more permissive than either AHA figure. If you want a single working rule, the sex-specific AHA ceilings are tighter than the 50-gram label value, so hitting the AHA number keeps you under the Daily Value automatically.
The health-halo trap: whole grain, fortified, and still sugary
Whole grains, added fiber, and a long list of fortified vitamins on the front of a box tell you nothing about the added-sugar line on the back. The two can sit side by side. The Nutrition Source documents one cereal marketed on exactly that healthy framing – whole grains, fiber, added antioxidant vitamins – that still carries 18 grams of added sugar, about 4.5 teaspoons, in a single small bowl. That is more than a third of the 50-gram Daily Value in one serving.
Fortification is real and separate from sugar. General Mills Total, per its manufacturer panel on SmartLabel, lists Iron at 18 mg, 100% of the Daily Value per cup. That is a genuine micronutrient figure. It also tells you nothing about the cereal’s added sugar, which is a different line entirely. Read the vitamins and the sugar as two unrelated columns, because the box is designed to let the good one distract from the other.
Per-brand cereal nutrition facts: sugar and fiber by the serving
Here is where everyday brands split. The figures below are per-serving values, but note the serving base differs by product – most are per 1 cup, Grape Nuts is per 1/2 cup – so read each against its own serving, not across the table cup-to-cup. Flakes, rounds, and biscuit cereals all pour differently.
Total Whole Grain cereal, from its retailer panel at H-E-B, logs 140 calories, 33 g total carbohydrate, 4 g dietary fiber, 6 g total sugars, and 5 g added sugars per 1-cup serving, with the added sugars at 11% of the Daily Value. The per-brand sugar and fiber values below are compiled per-serving nutrition figures from Verywell Health.
| Cereal | Serving | Fiber | Sugar (added) | Protein |
|---|---|---|---|---|
| Total Whole Grain | 1 cup | 4 g | 6 g total / 5 g added | – |
| Cheerios | 1 cup | 2.8 g | 1.3 g (under 1 g added) | – |
| Grape Nuts | 1/2 cup | 7.5 g | 5.1 g | 6.5 g |
| Frosted Flakes | 1 cup | 0.9 g | 13.9 g (13.7 g added) | – |
| Honey Smacks | 1 cup | – | 20.2 g (18 g added) | – |
The spread is the story. Cheerios carries 1.3 g sugar, less than 1 g of it added, with 2.8 g fiber per cup. Honey Smacks carries 20.2 g sugar, 18 g of it added, in the same unit of measure. Frosted Flakes sits at 13.9 g sugar with 13.7 g added and just 0.9 g fiber. Grape Nuts, at the half-cup, delivers 7.5 g fiber and 6.5 g protein against 5.1 g sugar – the added-sugar-down, fiber-up profile in one product.
For the full box-by-box breakdowns on individual brands, see our Frosted Flakes nutrition facts and Corn Flakes nutrition facts pages.
The 6-grams-per-ounce school rule, and why it is not your rule
You may have seen a “6 grams of added sugars” figure attached to cereal and assumed it was a per-serving guideline. It is not a consumer target. Under the USDA Food and Nutrition Service final rule on added sugars, breakfast cereals served in federal school meal and CACFP programs may have no more than 6 grams of added sugars per dry ounce.
That cap governs what cafeterias and childcare programs may buy and serve. It does not appear on retail labels, and it is not framed as a limit for an individual adult’s day. Treat it as a procurement standard for institutions. If you want it as a rough shopping heuristic, fine – but the number that belongs on your personal math is the added-sugars Daily Value, not the per-ounce school ceiling.
Added sugars and the youngest eaters
The added-sugar framing shifts for small children. The Nutrition Source notes that the Dietary Guidelines for Americans 2020-2025 advise all Americans 2 years and older limit added sugars to less than 10% of total calories, and that children and infants younger than 2 should not be given any added sugars at all.
That reframes the children’s-cereal aisle. For a toddler under 2, the target for added sugars in cereal is zero, not “a little.” Many brightly marketed children’s cereals clear 10 g of added sugars per serving, which puts them outside that guidance before milk is even poured. For this age group, an unsweetened cereal with fruit added at home is the version the guidance points to.
Added-sugar %DV for four cereals the brand table leaves off
The per-brand table lists added-sugar grams but not the percent of the Daily Value each serving spends. Running every added-sugar figure against the label’s 50 g Daily Value fills that in and lets you apply the FDA’s own low/high test (5% DV or less is low, 20% DV or more is high) to brands that don’t print a percentage. All figures below are per the serving shown, so compare each against its own serving, not cup-to-cup. Total Whole Grain is the check: 5 g added ÷ 50 g = 11% DV, exactly the panel value, confirming the method.
- Honey Smacks (1 cup): 18 g added ÷ 50 g = 36% DV – well past the 20% “high” line, in a single bowl.
- Cheerios (1 cup): under 1 g added ÷ 50 g = about 2% DV at most – below the 5% “low” mark.
- The spread: a cup of Honey Smacks carries 18 g added sugar against Cheerios’ under 1 g – roughly 18 times more added sugar for the same “1 cup” on the box.
Note: Grape Nuts is excluded here because its 5.1 g is total sugar on a 1/2-cup base, not a per-cup added-sugar figure, so it is not comparable to these.
FAQ
Does total sugars or added sugars matter more for cereal?
For comparing boxes, watch the added line. A cereal can post high total sugars honestly if it contains dried fruit, while a plain cereal with sweetener dumped in shows up only on the added line. Since Total Sugars has no percent reference and Added Sugars carries the 50-gram Daily Value, the added figure is the one you can benchmark.
In a single bowl, what counts as “a lot” of added sugar in grams?
Run it against the 50-gram Daily Value. A serving at 10 g already spends a fifth of the day’s reference, which clears the 20% high mark. At 18 g – the level one healthy-marketed cereal hits – a single small bowl burns more than a third of the daily allowance before anything else you eat or drink counts toward it.
Why does my bowl look bigger than the listed serving?
Because the serving reflects a weight band, not the volume you pour. A dense biscuit cereal lists against 60 g and a puffed cereal against 15 g, so the same visual scoop can be two or four listed servings depending on density. Weigh your usual pour once against the gram figure and you will know your real multiplier.
Are fortified cereals healthier than plain ones?
Fortification adds micronutrients like the 100% Daily Value of iron on some panels, but it operates independently of the sugar line. A fortified cereal can still carry 13 to 18 g of added sugars. The vitamins are a real benefit; they do not cancel a high added-sugar figure, so judge the two columns separately.
Which single comparison sorts a good cereal from a poor one fastest?
Two lines, read together: added sugars and fiber. A cereal with added sugars at 5% of the Daily Value or less and fiber up near the Grape Nuts range of 7.5 g per half-cup is doing the job. One high and one low tells you less; both pointing the right way is a reliable screen on the shelf.