At the dose a recipe actually calls for, one teaspoon of vanilla extract carries about 12.1 kcal and 0.53 g of carbohydrate. That is the number that matters, because almost no one measures this liquid by the cup. The vanilla extract nutrition facts below are read off the per-teaspoon panel in the University of Rochester Medical Center Health Encyclopedia, the per-serving records in FatSecret, and the USDA SR Legacy tables published by MyFoodAnalysis – then placed next to the figures imitation and alcohol-free versions report. The Tastybend Nutrition Desk aggregates declared values into standardized reference tables; nothing here is a measurement taken in a kitchen.
Quick answer: One teaspoon of vanilla extract has about 12.1 kcal, 0.53 g carbohydrate – all of it sugar – and no fat or protein. A tablespoon runs 37 calories with 1.64 g carbs. At teaspoon and tablespoon scale the sugar load is small enough to be irrelevant to most eating plans, including low-carb ones. The large per-cup totals you may see apply to a volume no recipe uses.
Calories Per Teaspoon, Per Tablespoon, Per 100 g, and Per Cup
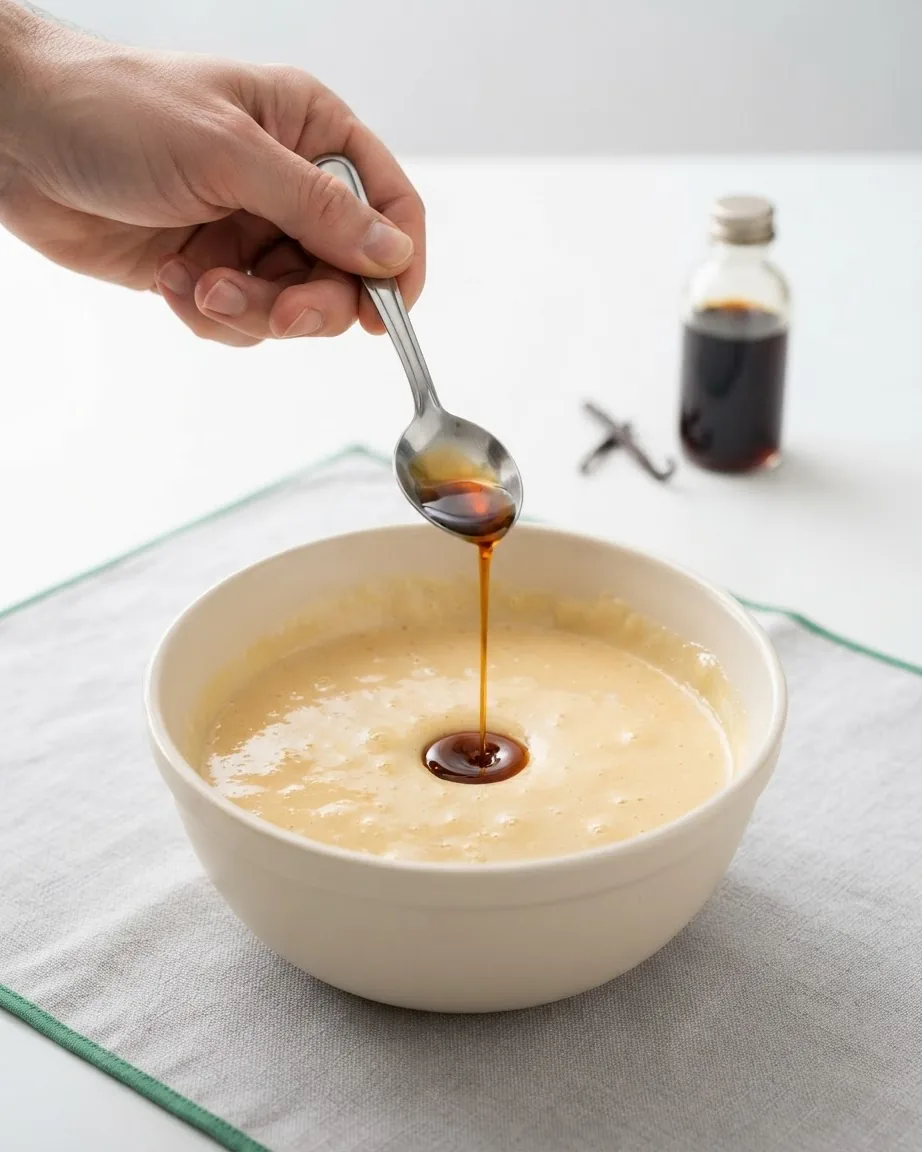
The gap between the small-dose number and the big-container number is where most confusion starts. A teaspoon and a tablespoon are what you pour into a batter; a 100 g or one-cup figure is a laboratory reference unit.
Read off the per-teaspoon panel in the University of Rochester Medical Center Health Encyclopedia, one teaspoon of vanilla extract lists 12.1 kcal and 0.53 g carbohydrate, with 0.53 g total sugars and no fat or protein (per-teaspoon panel). Step up to a tablespoon and FatSecret’s USDA-sourced record puts it at 37 calories and 1.64 g carbs (per-tablespoon record).
The per-cup figure comes from Recipal’s USDA-based label generator (per-cup label). No baker pours a cup of extract into anything, so the per-cup line is context, not a serving.
| Amount | Calories | Carbohydrate | Total sugars |
|---|---|---|---|
| 1 teaspoon | 12.1 kcal | 0.53 g | 0.53 g |
| 1 tablespoon | 37 calories | 1.64 g | – |
| 100 g | – | 12.7 g | 12.7 g |
| 1 cup (208 g) | 599 calories | – | 26 g |
The Full Macro Line: Protein, Fat, Sugar, Sodium, Fiber
The macro profile of pure vanilla extract is close to flat on everything except carbohydrate. The per-teaspoon panel lists 0 g protein and 0 g total fat, which also means no saturated fat and no cholesterol to log. Fiber is zero. Every one of the 0.53 g of carbohydrate in a teaspoon is sugar – there is no fiber or starch to subtract.
Sodium is the one mineral worth a sentence, and only to dismiss it: a teaspoon carries 0.38 mg, which rounds to nothing on any label. For the full macro line against one standardized unit:
- Protein: 0 g per teaspoon.
- Total fat: 0 g per teaspoon (no saturated fat, no cholesterol).
- Carbohydrate: 0.53 g per teaspoon, rising to 12.7 g per 100 g.
- Total sugars: 0.53 g per teaspoon – all of the carbohydrate.
- Fiber: 0 g.
- Sodium: 0.38 mg per teaspoon.
One line in the USDA database can mislead a quick reader: MyFoodAnalysis states that the extract’s “estimated share of calories is 0%, using 4 kcal per gram of protein.” That 0% refers to the protein share of calories, not the total – the product is not calorie-free (USDA SR Legacy record). Its calories are real; they just come from somewhere other than protein.
Where the Calories Actually Come From: Ethyl Alcohol
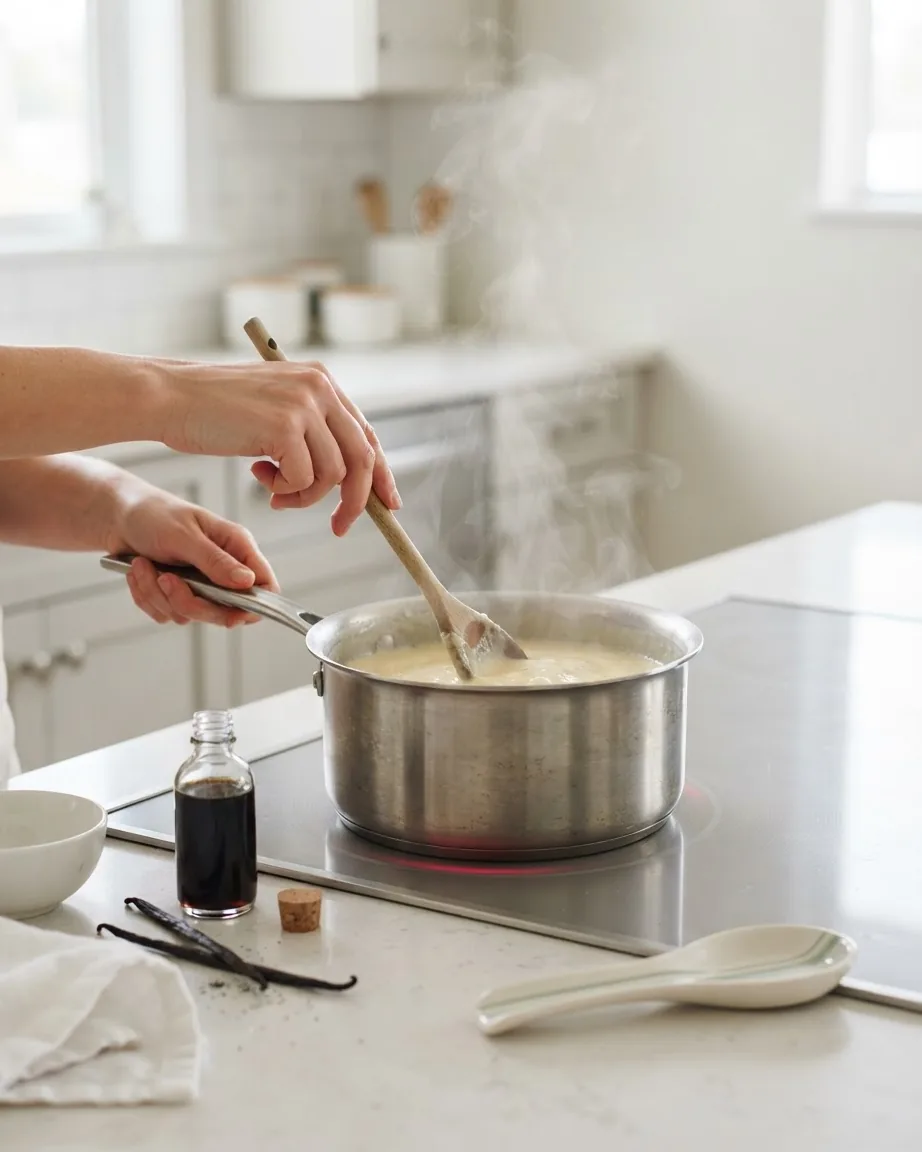
This is the fact a generic ingredient page skips. Pure vanilla extract is mostly a flavored alcohol solution, and the alcohol – not the sugar – supplies most of its energy. The USDA SR Legacy table reports 34.4 g of ethyl alcohol per 100 g, and at one-cup scale states that 71.6 g of alcohol accounts for 82% of calories (ethyl alcohol line).
That matters for anyone counting what ends up in a finished baked good. Alcohol evaporates with heat. Cookies, cakes, and custards that bake or simmer drive off a large share of that 82% component, so the calories you “add” from a teaspoon of extract are not the same as the calories that survive the oven. The sugar fraction – 0.53 g per teaspoon – stays; much of the alcohol-derived energy does not. A no-bake frosting or an unheated cream keeps more of it. The Desk does not measure retention rates, but the direction is set by the chemistry: heat removes alcohol.
This also explains why a straight calorie comparison between pure and imitation extract is a trap, which the next section takes up.
Why Vanilla Extract Must Be 35 Percent Alcohol
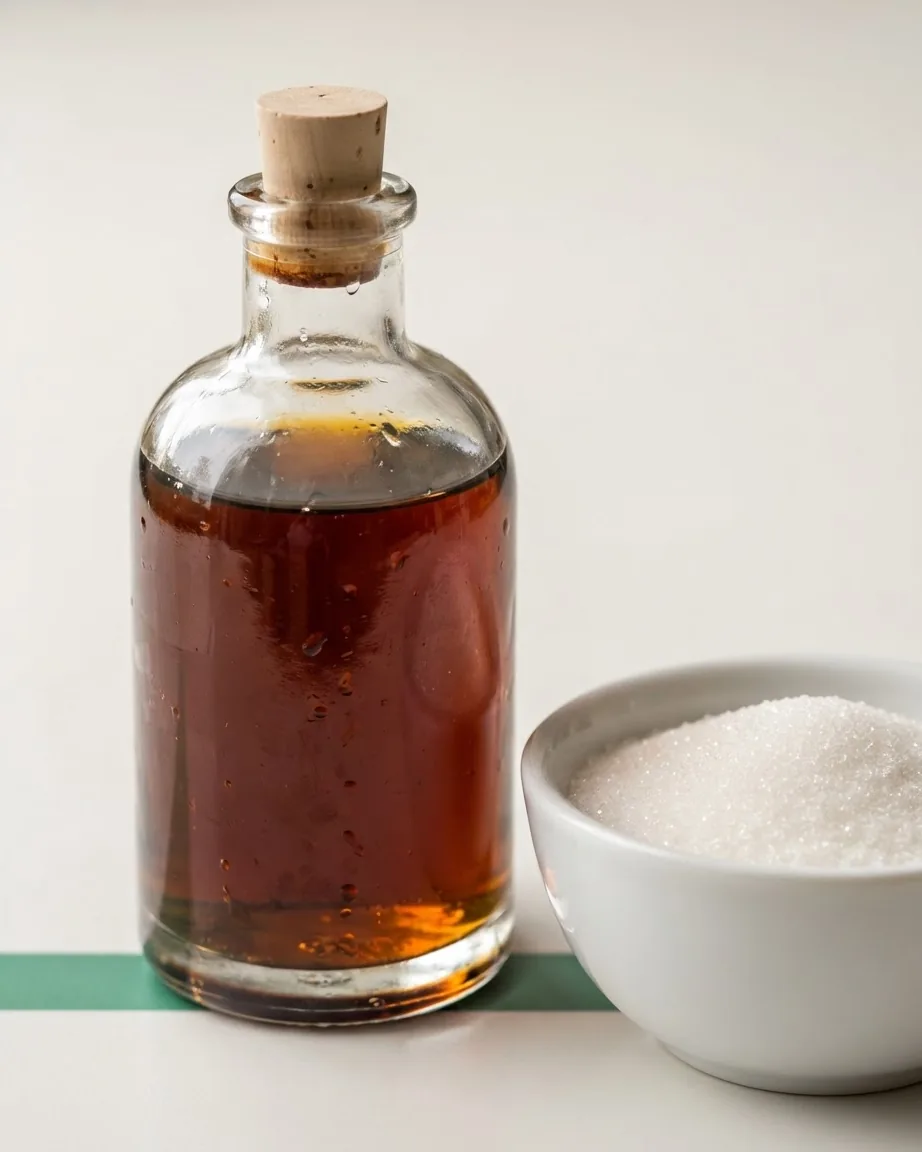
The alcohol is not an accident of recipe; it is the law. Under the federal standard of identity, vanilla extract must contain not less than 35 percent ethyl alcohol by volume (21 CFR 169.175). That single floor is why the per-100 g energy is dominated by alcohol rather than sugar, and why a product labeled “vanilla extract” cannot legally be the low-alcohol or alcohol-free kind.
The same regulation permits optional sweeteners – sugar, including invert sugar, dextrose, or corn syrup – among the allowed ingredients. That is the legitimate reason you may see a sugar on an ingredient list even though the base liquid is an alcohol solution. The standard sets both halves of the nutrition picture at once: a mandatory alcohol minimum that drives the calories, and permitted sugars that account for the carbohydrate line.
Pure vs. Imitation vs. Alcohol-Free: The Real Tradeoff
Switching to imitation or alcohol-free extract does lower total calories, but it does not lower sugar – it raises it. This is the comparison most people get backward.
Imitation vanilla extract with no alcohol lists 7 calories per tablespoon and, per 100 g, 14.4 g carbohydrate that is nearly all sugar, with 0.03 g protein and 0 g fat (imitation USDA record). It contains 0 g ethyl alcohol.
| Per 100 g | Pure vanilla extract | Imitation, no alcohol |
|---|---|---|
| Calories | – | – |
| Carbohydrate | 12.7 g | 14.4 g |
| Of which sugar | 12.7 g | 14.4 g |
| Ethyl alcohol | 34.4 g | 0 g |
So the imitation product has fewer total calories but more sugar carbohydrate. And because pure extract’s energy is mostly alcohol that largely burns off when heated, the raw 288-versus-56 gap overstates what reaches a baked product. For an unheated application the pure extract’s higher number is more real; for a hot oven, much of it leaves. Imitation like the one shown in MyFoodAnalysis’s own imitation vanilla extract nutrition facts entry carries the verified comparison above.
Keto and Low-Carb: Is a Teaspoon of Vanilla Extract a Problem?
At real baking doses, no. One teaspoon adds 0.53 g carbohydrate; one tablespoon adds 1.64 g. Both are rounding error against a daily low-carb allowance, and both are entirely sugar with no fiber to net out. A whole-recipe pour of a teaspoon or two does not move a keto count.
The intimidating figures – 12.7 g carbohydrate per 100 g, 26 g total sugars per cup – only apply at volumes a recipe never calls for. Treat the per-100 g and per-cup columns as reference units, not servings. A reader on a strict low-carb plan can use either pure or imitation extract at a teaspoon without meaningful effect, with the note that imitation carries slightly more sugar per unit weight. For the wider category, see our pantry basics section.
Vitamins and Minerals: Why They Only Show Up at Cup Scale
You may see vanilla extract credited with a respectable manganese number. That credit is honest but misleading at the dose you use. .
Divide a cup down to the teaspoon a recipe actually uses and those percentages round to nothing. Vanilla extract is not a mineral source in any practical sense; it is a flavoring whose micronutrient content is only visible when you measure it in a unit nobody cooks with. For comparison with foods where cup-scale minerals do matter, see our ice cream nutrition facts guide and our Oikos Yogurt breakdown.
A Note on Rounding: Why You See 1.64 g and 2 g for the Same Spoon
One small discrepancy is worth naming so it does not read as an error. FatSecret’s USDA record gives 1.64 g carbs per tablespoon, while some tools round the same figure to 2 g. These are not two different foods or two different measurements – they are the same underlying USDA data shown at different precision. The same holds for the per-100 g carbohydrate line, which appears as roughly 12.65 g in one record and 12.7 g in another. When a precise count matters, 1.64 g per tablespoon and 12.7 g per 100 g are the finer figures.
Pure vs. Imitation, Side by Side: Fewer Calories but More Sugar
Most people assume alcohol-free imitation extract is the lighter choice across the board. Run the two USDA records against each other per 100 g and the trade splits in two directions: imitation saves calories but costs sugar.
- Calorie ratio: 288 ÷ 56 = pure extract carries about 5.1× the calories of imitation, gram for gram.
- Sugar added: 14.4 g (imitation) − 12.7 g (pure) = 1.7 g more sugar-carbohydrate per 100 g in the imitation product.
So the switch is not a free win. For a hot oven, the calorie gap shrinks toward the sugar line; for an unheated frosting, the pure figure is closer to real.
Frequently Asked Questions
Does the alcohol in vanilla extract make it unsafe for kids or anyone avoiding alcohol?
Pure extract is 34.4 g ethyl alcohol per 100 g by law, but a teaspoon contributes a tiny absolute amount, and heated recipes drive most of it off. Anyone who must avoid alcohol entirely – for religious, medical, or recovery reasons – can choose an imitation product listing 0 g ethyl alcohol instead.
Which has more sugar, pure or imitation vanilla?
Imitation, no alcohol, carries more: 14.4 g carbohydrate per 100 g against 12.7 g for pure, and in both cases that carbohydrate is essentially all sugar. People assume the “lighter” imitation is also lower in sugar – it is lower in total calories because it lacks alcohol, not because it has less sugar.
Is there any protein or fat worth logging?
None. Pure extract shows 0 g protein and 0 g fat per teaspoon, so there is no saturated fat or cholesterol to track either. The USDA note that its “share of calories is 0%” refers only to protein’s contribution, not to total calories – the product still carries its 12.1 kcal per teaspoon.