Lucky Charms cereal nutrition label numbers open with one blunt fact: roughly one-third of the calories in a standard serving come from added sugar. That ratio, worked out from the commonly reported figures on the panel, explains why the box sparks so much argument at the breakfast table. The rest of the label is a mix of fortification, refined grain, and a marshmallow that no public database fully breaks apart.
Here is what the printed panel says, what it leaves out, and why the numbers shift depending on where you look.
The 36-gram serving and where the 140 calories go
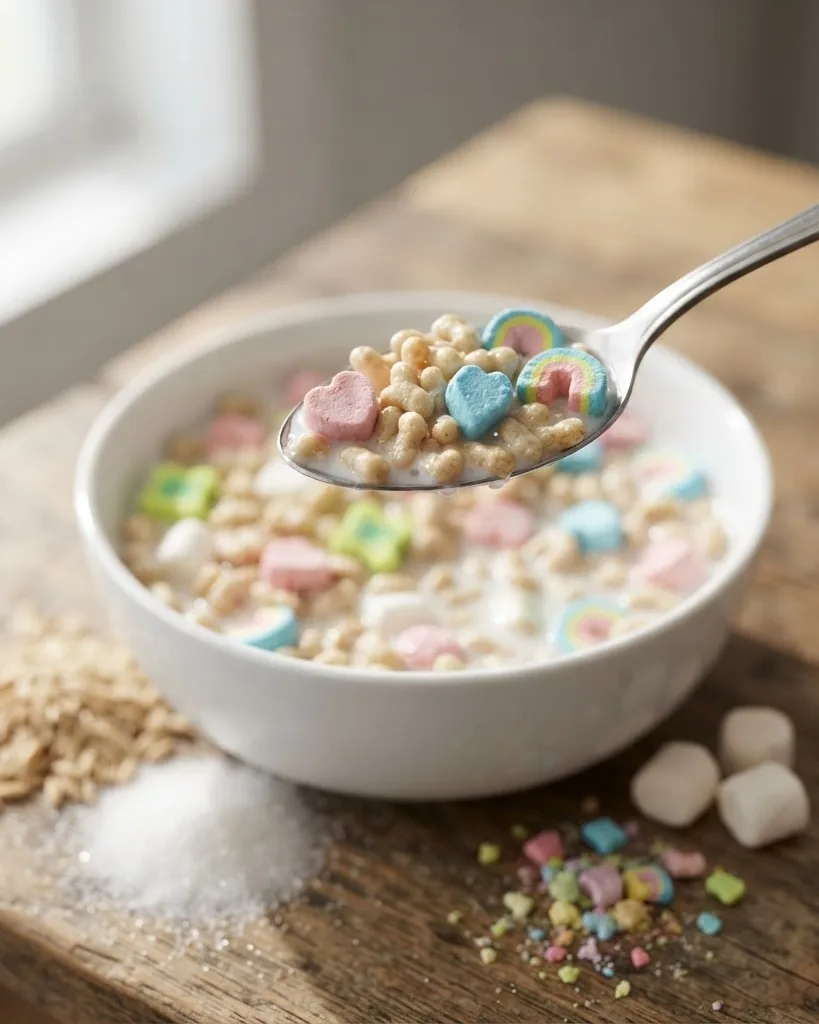
The lucky charms cereal box nutrition label starts, as every U.S. panel does, with a serving size. For Lucky Charms that serving is commonly listed as approximately 36 grams, which the nutrition summary on the Lucky Charms reference entry at Wikipedia equates to roughly one cup of dry cereal.
At that 36-gram pour, the same summary reports about 140 kilocalories. Not a huge number for a full cup of anything. The catch is what those calories are made of, and the fiber-to-sugar ratio is the fastest way to see it.
Break the panel into its macros and a pattern shows up fast:
- Calories: about 140 kcal per 36 g serving.
- Sugar: approximately 10 to 12 grams, most of it added.
- Dietary fiber: about 2 grams.
- Protein: a small amount from the grain itself, well under what a splash of milk adds.
Two grams of fiber against ten to twelve grams of sugar is the whole story in miniature. A cereal built around whole grain tends to invert that ratio, carrying more fiber than sugar per serving. This one does not, and the panel makes no attempt to hide it; the numbers are printed in plain sight, right where the fiber and sugar rows always sit on a U.S. label.
Scale the serving up and the pattern holds. Two servings, 72 grams of dry cereal, would carry roughly 280 kilocalories, about 20 to 24 grams of sugar, and only about 4 grams of fiber. Nobody measures a level double cup at 6 a.m., which is exactly why the printed serving size and the actual bowl tend to drift apart in practice.
Manufacturers reformulate. General Mills, the company behind the brand, adjusts recipes over time, so the 140-kcal figure is best confirmed against the physical box in front of you rather than trusted forever. Reference tables lag the shelf by months, sometimes longer, which is why a number quoted in an old article can be technically outdated even when it was accurate the day it was written.
Total sugars versus added sugars: the line the 2016 overhaul created
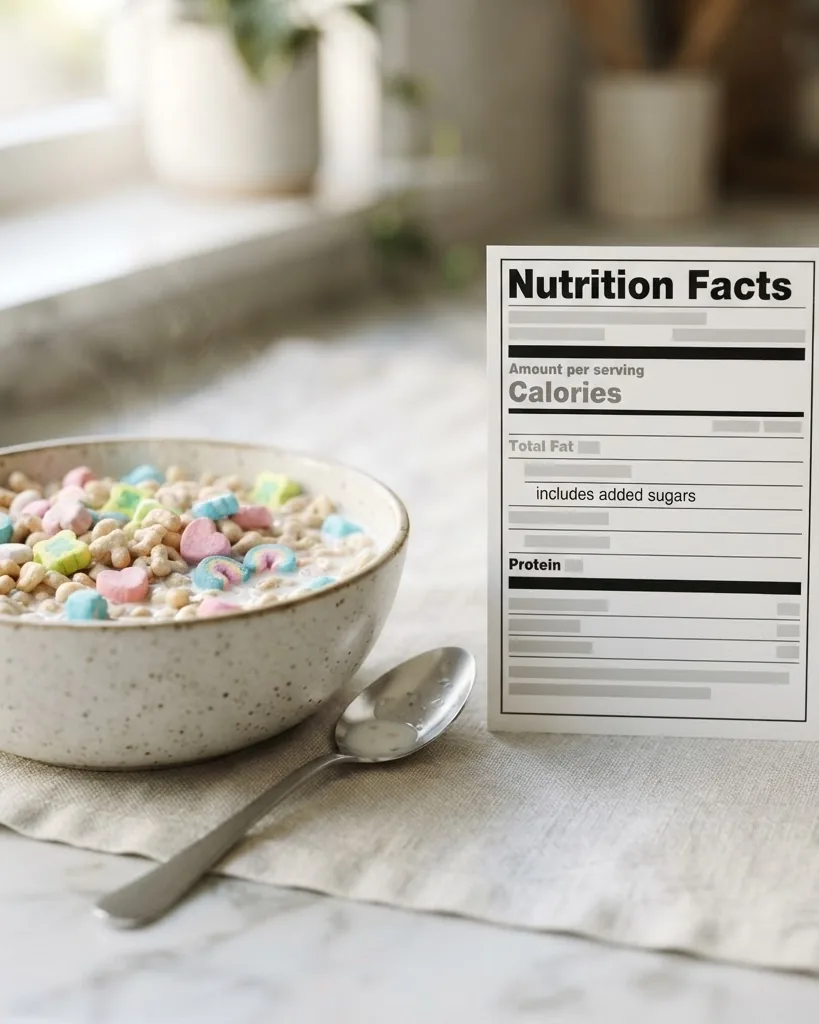
Before 2016, no U.S. cereal box was required to tell you how much of its sugar was added during manufacturing versus present naturally. The Food and Drug Administration changed that with the Nutrition Facts label redesign, phasing in an “Added Sugars” line indented beneath “Total Sugars.” The FDA overview of what changed on the label lays out why the agency singled sugar out for its own dedicated row.
For a product like this, that line matters more than almost any other. The oats and grain contribute little natural sugar. The marshmallow pieces and the coated grain carry the load, which is why the large majority of the ten to twelve grams per serving lands in the added-sugars column rather than the total-sugars-only bucket.
Why does the distinction earn its own indented row? Because natural sugar arrives packaged with fiber and water inside fruit or dairy. Added sugar arrives naked, with none of that buffering. Your bloodstream treats a spoonful of table sugar and a spoonful of the sugar coating a marshmallow marbit essentially the same way, which is the physiological reason regulators wanted the two categories separated instead of lumped into one line.
The FDA’s added-sugars line also carries its own percent Daily Value, calculated against a 50-gram reference amount for a 2,000-calorie diet. That percentage is a regulatory reference point, not a personal limit, but it is a fast way to see how far one serving reaches into a full day’s allowance.
The chocolate lucky charms cereal nutrition label follows the identical structure, listing total sugars first and the added-sugars subtotal underneath. Flavor variants change the coating and the color additives more than they change the labeling logic; the two-line sugar format is fixed by federal rule, not by the manufacturer’s discretion.
If you want to see how a different sugary cereal handles the same two-line problem, the fight between old and new serving sizes on the Fruit Loops nutrition facts breakdown shows exactly how a reformulated gram figure can make an identical product look different on paper.
How one bowl stacks up against a full day of added sugar
Context is where the sugar line stops being abstract. The American Heart Association publishes some of the most widely cited ceilings for added sugar, and they are not generous. Per the AHA guidance on added sugars, most women should cap added sugar at no more than about 25 grams (6 teaspoons) per day, and most men at no more than about 36 grams (9 teaspoons) per day.
Run the arithmetic. A single serving at roughly 12 grams of added sugar burns through nearly half of the 25-gram daily allowance the AHA suggests for most women. For a man’s 36-gram ceiling, one bowl is exactly a third, before coffee, before lunch, before anything else touches the plate.
Put in teaspoons, since that is the unit the AHA itself uses, one serving of Lucky Charms lands at roughly 2.5 to 3 teaspoons of added sugar. A woman working within a 6-teaspoon daily budget has spent half of it on breakfast alone. A man working within a 9-teaspoon budget has spent close to a third.
Children make the picture starker. The AHA recommends even tighter limits for kids, and a child rarely pours a level 36-gram cup. They pour until the bowl looks full, which in practice often means one and a half to two adult-sized servings before milk ever hits the bowl.
The Centers for Disease Control and Prevention frames the population-level version of this concern. Its public-health nutrition guidance treats added sugar from beverages and sweetened breakfast foods as a recurring driver of excess intake among school-age children specifically, not as an isolated brand-level issue.
None of this makes the cereal poison. It makes it a treat wearing a breakfast costume, which is roughly how most independent nutrition professionals classify it. The Academy of Nutrition and Dietetics, the professional body for registered dietitians, generally frames heavily sweetened, low-fiber cereals of this kind as occasional foods rather than everyday staples, a framing its general dietary guidance echoes across similar products.
The illustrative math: about a third of the calories are sugar
You can turn the sugar line into a share of the whole bowl with one conversion. Sugar carries 4 kilocalories per gram, a fixed value used across every nutrient calculation, whether the sugar comes from a marshmallow, a soda, or a piece of fruit.
Take the commonly reported 12 grams of added sugar and the commonly reported 140 kilocalories per serving:
- 12 g of added sugar times 4 kcal/g equals 48 kcal from added sugar.
- 48 kcal divided by 140 kcal, times 100, is approximately 34 percent.
So roughly one-third of the energy in a serving comes from added sugar alone. Treat that 34 percent as illustrative rather than an official label statistic, since it is built from commonly reported values rather than a machine-verified live panel. Swap in a different lot’s numbers, say 10 grams of sugar instead of 12, and the share drops closer to 29 percent; push it to the upper end of the range and it climbs toward 37 percent. The exact figure moves within a fairly narrow band no matter which end of the reported range you use.
Run the same math on two servings with a cup of milk added and the picture softens slightly, because milk brings calories without adding much sugar of its own beyond lactose. Two servings of dry cereal at roughly 280 kcal, plus one cup of 2% milk at about 122 kcal, brings the bowl to roughly 402 kcal total, while the added sugar stays close to 20 to 24 grams. That pushes the added-sugar share of total bowl calories down to somewhere in the high teens to low twenties, simply because the milk dilutes the ratio without changing the sugar amount.
The takeaway survives the imprecision either way. When a quarter to a third of a food’s calories arrive as added sugar, no amount of added vitamins reclassifies it as a health food by itself.
Iron, B-vitamins, and the fortification that props the label up
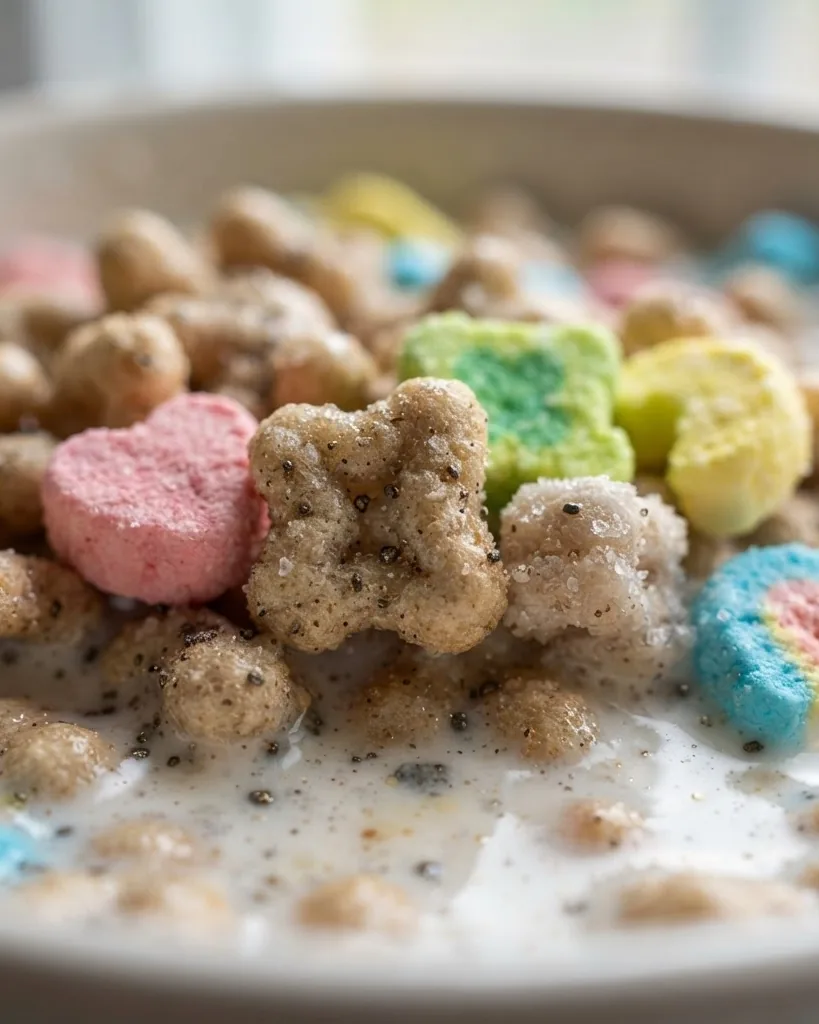
Fortification is the counterweight the box leans on. Lucky Charms is heavily enriched with iron and B-vitamins, thiamin, riboflavin, niacin, B6, folate, and B12 among them, plus vitamin D, each printed with a percent Daily Value beside it. This is deliberate. The added micronutrients let the front of the box make claims the sugar line would otherwise undercut, and it is a pattern shared across most heavily processed, kid-marketed breakfast cereals, not unique to this brand.
The iron number is where secondary sources stop agreeing. Some report roughly 3 to 4 milligrams per serving, around 20 percent of the adult Daily Value. Other aggregators cite figures well above that. Because no single value could be pinned to one resolvable, authoritative source, treat the iron content as a range and read it off your actual box rather than off any single article, including this one.
Where do you settle the dispute? A live listing in USDA FoodData Central, the federal nutrient database, is the right tie-breaker. The USDA FoodData Central search tool lets you pull the branded entry and compare it against whatever a reference article claims, and it is updated on a different schedule than most secondary summaries, so it tends to reflect a more current formulation.
A word on what fortification does and does not do. Iron and folate added to refined grain are genuinely useful nutrients, and enriched cereal has historically been a meaningful folate source in the U.S. diet, particularly for people who eat little else fortified in a typical day. But a Daily Value percentage for iron does not cancel a Daily Value percentage for added sugar. They sit on the same panel doing opposite jobs, and reading only one of the two rows gives a distorted picture either way.
General Mills, whose corporate site hosts current brand and product information, markets the fortification prominently on packaging and in advertising, which is standard practice across the category rather than something specific to this one product.
For a cereal that plays the same fortification game with a very different sugar profile, the full panel walk-through in the nutrition information for Goldfish crackers is a useful side-by-side.
The ingredient list: refined grain, corn syrup, and four named dyes
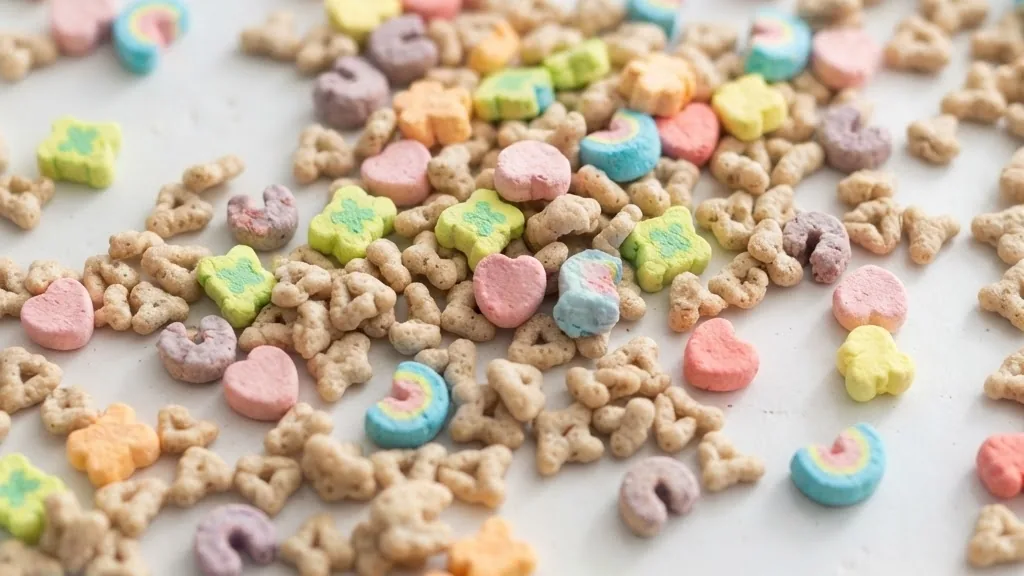
Read the ingredients rather than the front of the box and the marketing thins out. The base is a mix of refined and enriched grain plus the marshmallow pieces the company calls marbits. It is not a predominantly whole-grain product, whatever the oat imagery on the front suggests.
The sweetening comes from sugar and corn syrup. The marbits themselves are built from sugar, modified corn starch, and gelatin. General Mills does not publish a separate ingredient or nutrient breakdown isolating the marshmallow pieces from the oat cereal base, so the specific sugar and starch contribution of the marbits alone is not independently documented anywhere public. Anyone trying to calculate “sugar per marbit” versus “sugar per oat piece” is working from an estimate, not a disclosed figure.
The colors that make the marshmallows pop are printed by name:
- Red 40
- Yellow 5
- Yellow 6
- Blue 1
Here is a gap the label will not fill. The panel lists each dye by name but never discloses the milligram quantity of any of them per serving. That absence is not an oversight. The FDA does not require quantitative dye disclosure on consumer nutrition labels, so “Blue 1” tells you it is present and nothing about how much.
Formulation drift complicates even the names. General Mills has moved some products toward “natural” colors in certain markets over the years, and grain ratios and sugar content get nudged between revisions. A box printed two years apart may not carry an identical color line. The current shelf box is the only authority on the current recipe, and even that box may differ from the same product sold outside the United States, since U.S., Canadian, and other international versions can differ in fortification levels, color additive sourcing, and even base grain composition. Most publicly available nutrition summaries describe the U.S. version only.
Gelatin and gluten: two restrictions the panel handles poorly
Two groups of eaters get shortchanged by this label, and both deserve a straight answer.
The marshmallow pieces contain gelatin, commonly pork-derived. That makes standard Lucky Charms non-vegetarian, and it raises a religious-dietary flag the box does nothing to resolve. The label names gelatin but does not specify its animal source. Consumers with kosher, halal, or vegetarian requirements typically have to contact the manufacturer directly, because the standard panel simply will not tell them, and no third-party database reviewed for this article listed a confirmed gelatin source either.
Gluten is the second unresolved question. The grain base is oat-forward, and General Mills has released gluten-free versions of some cereals under separate product lines. But specific parts-per-million gluten testing data for the standard Lucky Charms oat sourcing is not detailed in consumer-facing materials. “Oat-based” is not the same as “certified gluten-free,” and the standard box does not carry the certification, so anyone managing celiac disease or a diagnosed gluten sensitivity should not assume the regular product is safe based on the oat content alone.
If either restriction applies to your household, the printed panel is a starting point, not a verdict. The manufacturer’s consumer line answers what the label omits, and for gluten specifically, a dedicated gluten-free product line, where one exists, is a more reliable choice than trying to interpret the standard box.
What milk adds, and why the bowl beats the box
Almost nobody eats this cereal dry, which means the label understates the real bowl. The panel describes 36 grams of cereal in isolation. The eater adds milk, and often adds more than one label cup of cereal.
Start with the milk. One cup (244 grams) of 2% reduced-fat milk contributes approximately 122 kilocalories and about 8 grams of protein, based on generic milk values maintained in USDA FoodData Central. The federal FoodData Central database is the reference for that generic-milk figure.
Stack it on the cereal and the arithmetic moves:
- 140 kcal of dry cereal plus 122 kcal of 2% milk is about 262 kcal for the combined bowl.
- The protein jumps meaningfully, since the milk alone brings roughly 8 grams while the dry cereal contributes little.
The milk also carries its own natural sugar as lactose, which lands in total sugars rather than added sugars on a milk label. So the sweetness you taste in a finished bowl comes from two different sources that two different panels count two different ways: the cereal’s added sugar and the milk’s naturally occurring lactose.
Serving-size realism is the honest caveat. If a child pours a heaping bowl closer to two label servings and floods it with milk, the added-sugar total can quietly double past what the box row implies, even though nothing about the box itself changed. The panel is accurate. The pour is the variable.
For a protein-forward comparison of what a poured cup of dairy actually delivers, the variety-by-variety numbers in the Fairlife milk nutrition facts breakdown show how much the milk half of the equation can swing, since not every milk product on the shelf delivers the same 8 grams of protein per cup.
Where the numbers disagree, and how to settle it
The lucky charms cereal nutrition facts label looks fixed, but the figures floating around it are not. Three forces pull the reported numbers apart, and knowing them saves you from trusting a stale table.
First is formulation drift. General Mills periodically adjusts sugar content, color sourcing, and grain ratios. A reference article written against an older box may misreport a current box by a gram or two of sugar or a full color additive.
Second is market variation. U.S., Canadian, and other international versions can differ in fortification levels, color additive sourcing, and even base grain. Most publicly available summaries describe the U.S. version only, so a figure quoted from a foreign box may not match yours.
Third is database lag. Third-party aggregators copy from each other and from old boxes, which is exactly how the iron figure fractured into a range in the first place. Once one outdated number gets copied into enough secondary sources, it starts to look like a consensus even when the underlying box has already changed.
Some data simply does not exist to be reconciled. No peer-reviewed, product-specific glycemic index study for Lucky Charms appears to be publicly documented, so any GI figure you see online is extrapolated from similar refined-grain, sugar-coated cereals rather than measured for this one. Likewise, no large cohort or epidemiological study appears to isolate “Lucky Charms consumption” specifically as a variable; health inferences discussed anywhere, including in this article, are drawn from broader research on high-added-sugar, low-fiber breakfast cereal patterns generally, not from a study that tracked this specific product.
The fix for the label-figure disagreements is boring and reliable. Read the physical box for the current recipe, then cross-check any disputed micronutrient against a live USDA FoodData Central listing. Between the shelf and the federal database, almost every disagreement resolves.
A quick checklist for comparing your box to the numbers above
Before assuming an article or a database entry is wrong, run through a short checklist. Most apparent contradictions trace back to one of these causes rather than an actual error.
- Check the country of purchase. A Canadian or other international box may legitimately show different fortification or color figures than the U.S. version described here.
- Check the print date or lot code if visible. A box from a different production run may reflect a formulation change that a reference article has not caught up to yet.
- Check whether the figure you are comparing is for dry cereal only or for cereal with milk. Combined-bowl numbers and dry-cereal numbers are not interchangeable.
- Check whether the serving size matches. A gram figure calculated against a 36-gram serving will not match one calculated against a different reference amount.
- Check the source itself. A live USDA FoodData Central entry or the current physical package outranks a secondary summary that may be citing an older source in turn.
Reading the panel like it is meant to be read
A nutrition label is a contract, not an advertisement. The front of the Lucky Charms box sells oats and vitamins. The panel on the side quietly reports that a third of the calories are added sugar, that fiber sits at about 2 grams, and that four dyes color the marshmallows in undisclosed amounts.
Both things are true at once. The cereal is genuinely fortified with iron, folate, and B-vitamins, and it is genuinely sugar-dense enough that the AHA’s daily ceilings turn a single bowl into a meaningful chunk of the day’s allowance.
Whether that trade works for your table is a judgment call, not a nutrition-science verdict. What the label gives you is the honest ledger to make that call with, provided you read the current box and check the disputed lines against a federal database rather than an old summary.
Added sugar and children’s intake is a sensitive area for a lot of families. If the sugar side of this ledger is a real concern for someone in your household, a registered dietitian or pediatrician can turn these label numbers into advice that actually fits that person.
FAQ
How many calories are in a serving of Lucky Charms?
A standard 36-gram serving, roughly one cup dry, is commonly reported at about 140 kilocalories. That figure comes from the Lucky Charms nutrition summary, but since General Mills periodically reformulates, it is worth confirming against a current physical box.
How much sugar is in a serving of Lucky Charms?
A serving contains approximately 10 to 12 grams of sugar, and the large majority of that is classified as added sugar under current FDA labeling rules. Very little of it comes from the grain itself; most is added during processing and marshmallow coating.
What percentage of Lucky Charms calories come from added sugar?
Using the commonly reported 12 grams of added sugar at 4 kilocalories per gram against the roughly 140 kcal serving, added sugar accounts for approximately 34 percent of the calories. That figure is illustrative, since it relies on commonly reported rather than live-verified numbers.
Does Lucky Charms contain gelatin, and is it vegetarian?
Yes, the marshmallow pieces contain gelatin, commonly pork-derived, which makes standard Lucky Charms non-vegetarian. The label names gelatin but does not specify its animal source, so consumers with kosher, halal, or vegetarian requirements typically need to contact the manufacturer directly.