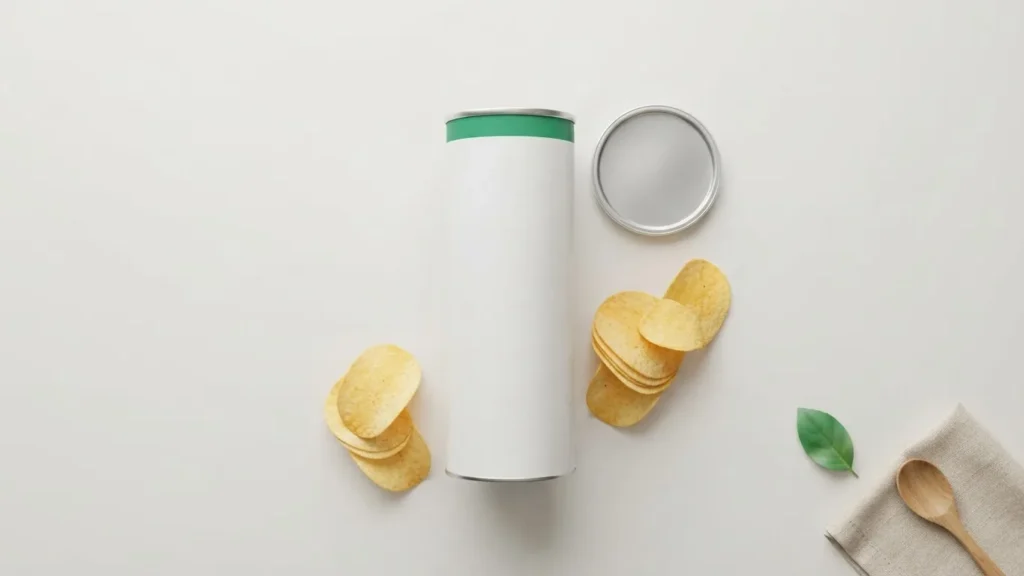
A 28 g serving of US Pringles Original – about 15 crisps – carries 150 calories, but the same tube holds roughly five of those servings, and the EU version of the crisp is counted, salted, and reported by a different set of rules entirely. These Pringles nutrition facts are aggregated directly from the manufacturer panel, the European brand label, and public food databases, then set side by side so the numbers that disagree are visible rather than averaged away. The gap between one serving and one tube is where most snackers get surprised.
This desk formats declared values; it does not weigh, taste, or test the product, and manufacturers can change a recipe without notice.
The 28 g US Serving: 150 Calories and 15 Crisps
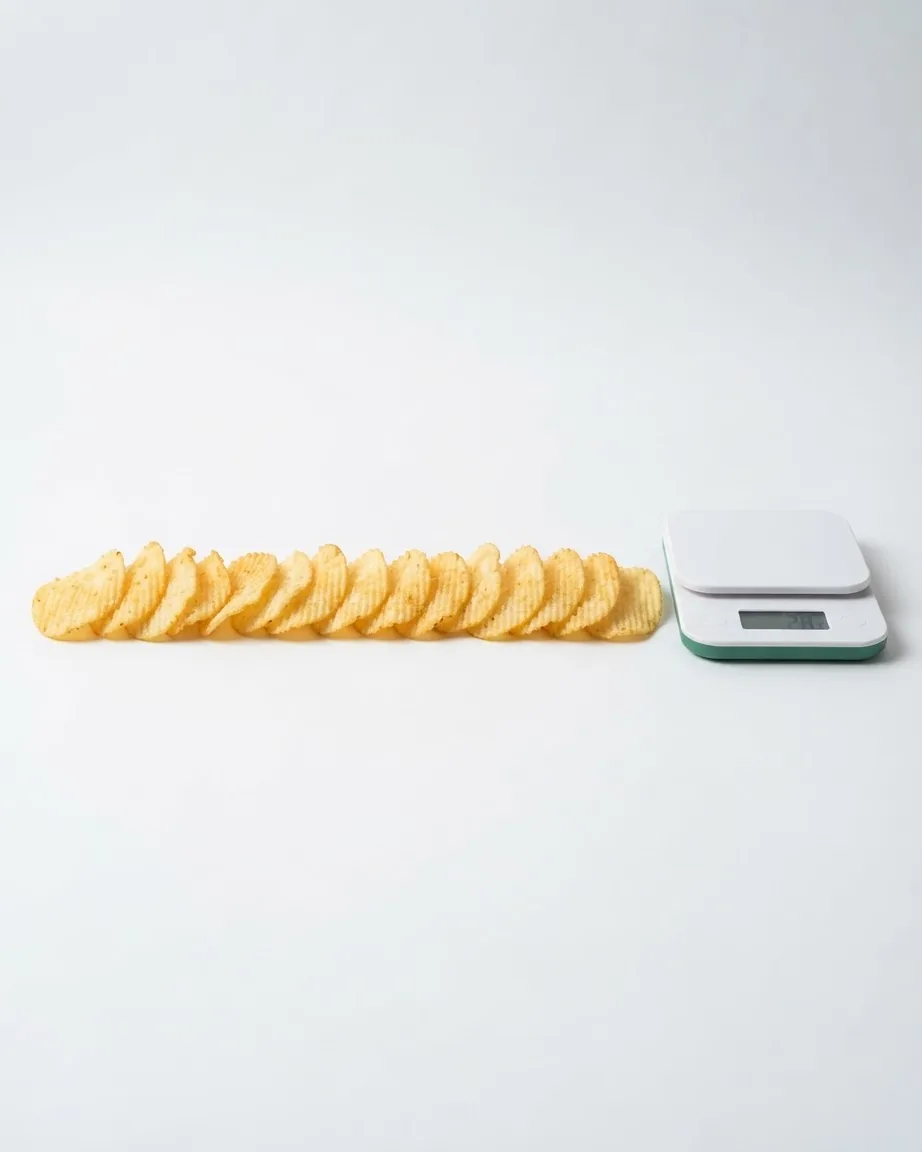
The reference serving on the US can is 28 g, which the Kellanova SmartLabel panel counts as about 15 crisps, with roughly 5 servings per container. At that serving, the SmartLabel declaration from Kellanova lists 150 calories, 9 g total fat (2.5 g saturated, 0 g trans), 150 mg sodium at 7% DV, 17 g total carbohydrate, and less than 1 g dietary fiber.
The per-crisp math is the part the label buries, because the flat stacking of Pringles makes 15 disappear faster than 15 of a bulkier chip. Sodium is the other line to log: 150 mg per serving reads low, but it scales with every additional handful, and few people stop at one measured 28 g pour.
Standalone Answer: The Pringles Numbers That Settle Most Questions
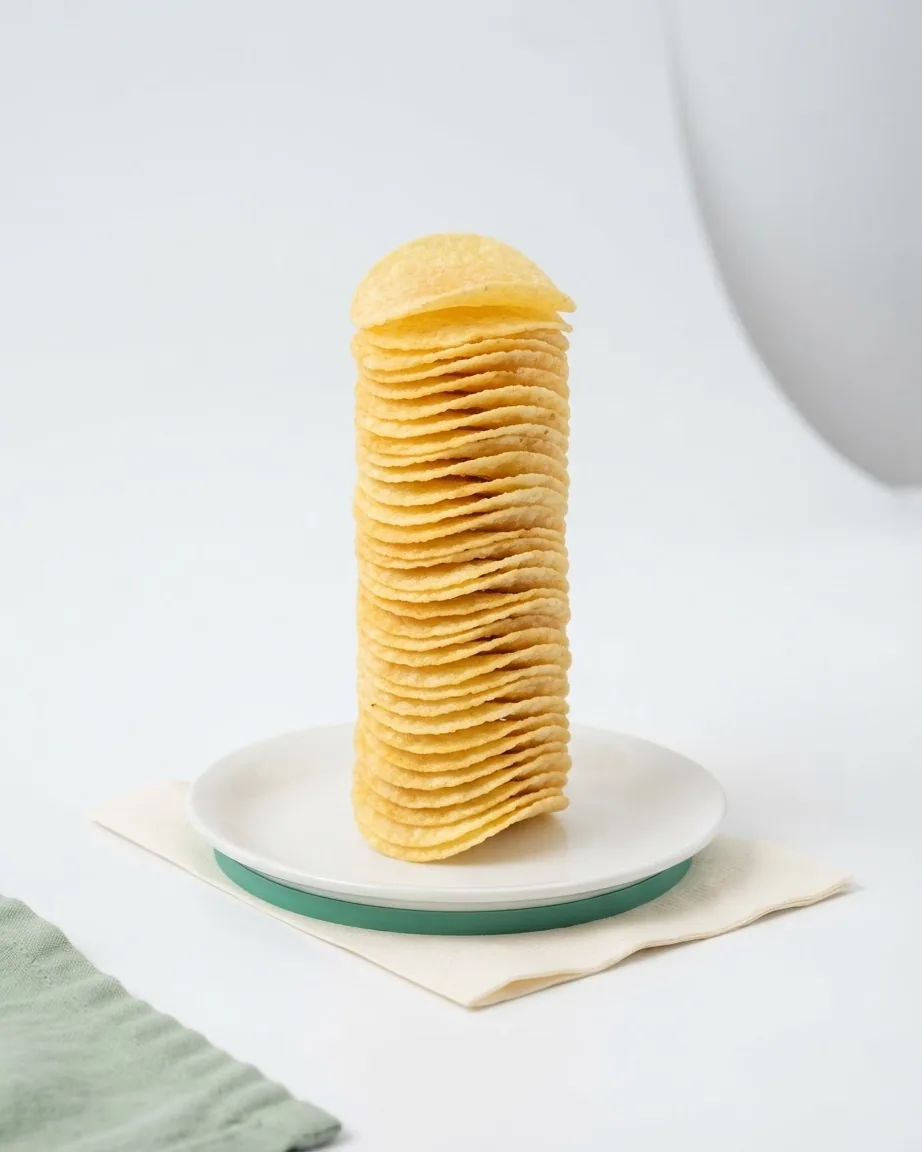
Pringles nutrition facts start with the serving. In the US, one 28 g serving (about 15 crisps) is 150 calories, with 9 g total fat, 2.5 g saturated fat, 0 g trans fat, 17 g total carbohydrate, under 1 g fiber, and 150 mg sodium. The tube holds about 5 servings. The EU Original label reports differently: 528 kcal per 100 g, 158 kcal per 30 g, 31 g fat per 100 g (of which 3.0 g saturates), 6.2 g protein per 100 g, 54 g carbohydrate per 100 g, and salt – not sodium – at 1.0 g per 100 g and 0.3 g per 30 g. Both formulations contain wheat.
EU vs US: Why the Same Crisp Reports Two Different Panels
Cross the Atlantic and the crisp changes its paperwork. The US panel uses a 28 g serving and reports sodium in milligrams; the European label uses a 30 g suggested serving – about 13 crisps rather than 15 – and reports salt in grams. Those are different units measuring related but not identical things, so a direct number-to-number comparison misleads unless you first agree on what is being counted.
The European figures come from the brand itself. Pringles for Eastern Europe states 528 kcal per 100 g and 158 kcal per 30 g, with 31 g fat per 100 g of which 3.0 g saturates, 6.2 g protein per 100 g, and 54 g carbohydrate per 100 g. Salt lands at 1.0 g per 100 g and 0.3 g per 30 g.
For a household comparing labels, the practical takeaway: the EU 30 g serving at 158 kcal and the US 28 g serving at 150 kcal are close once you account for the 2 g size difference. The salt-versus-sodium switch is the trap. A grams-of-salt figure and a milligrams-of-sodium figure are not the same measurement, and reading 0.3 g and 150 mg as interchangeable is the mistake to avoid.
Reading the Full Macro Line: Fat, Carbs, Protein, Sodium, Fiber
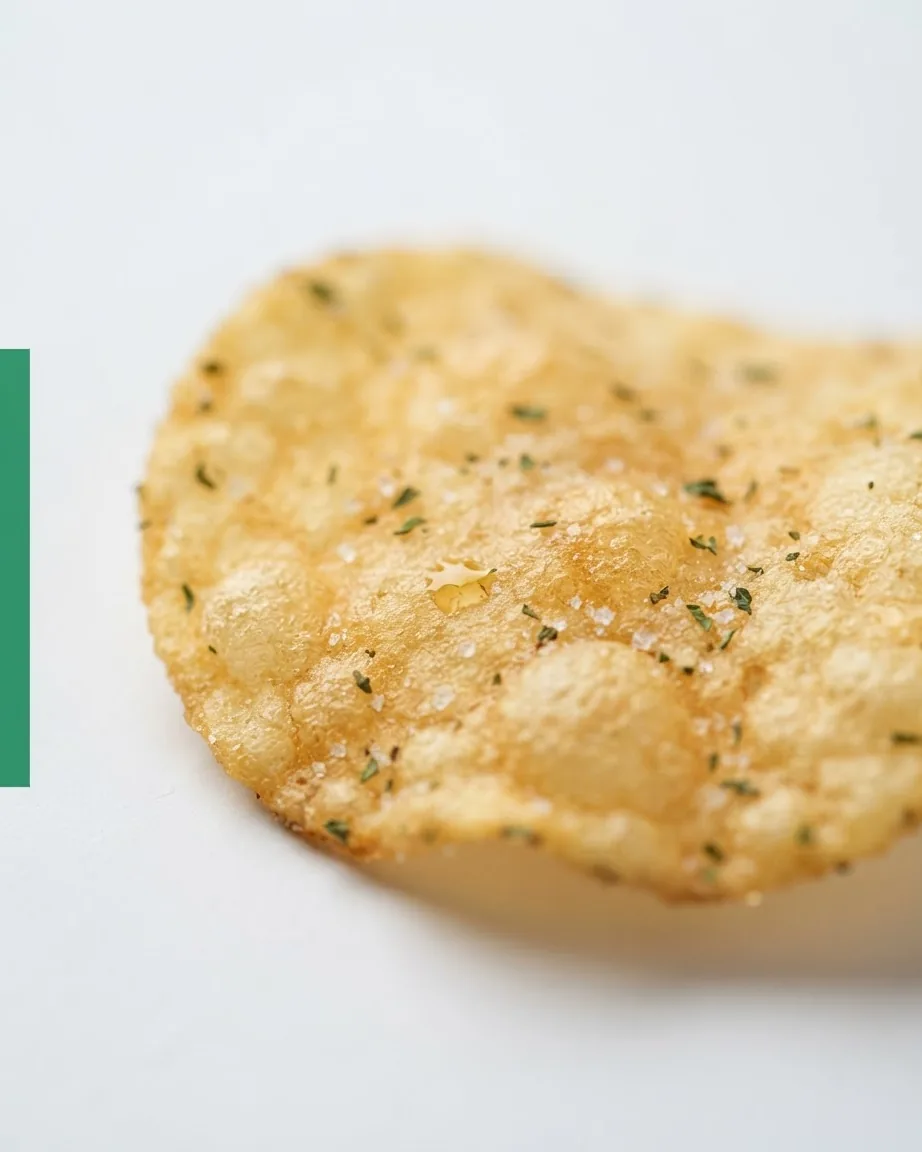
The complete US macro line for a 28 g serving: 150 calories, 9 g total fat, 2.5 g saturated fat, 0 g trans fat, 17 g total carbohydrate, less than 1 g dietary fiber, 150 mg sodium. The US panel this desk extracted does not surface a clean protein figure per serving; the European label fills that gap at 6.2 g protein per 100 g.
Fat is where Pringles earns its reputation. FatSecret’s breakdown puts the calorie split at 53% fat for the 28 g serving, meaning roughly half of every crisp’s energy comes from oil rather than potato. Fiber is the mirror image: under 1 g per serving is effectively a rounding artifact, so these crisps add bulk to a snack without adding the fiber that would slow it down.
Context helps. A serving of Pringles is denser in fat than many pantry staples people snack on. If you are comparing a savory crisp against a can of protein, the Baked Beans Nutrition: The Numbers Behind the Can breakdown shows how differently a fiber-and-protein food fills the same calorie slot. For a grab-and-go protein comparison, Cheese Stick Nutrition Facts: What One 28g Stick Actually Puts on the Panel uses the same 28 g reference weight.
US Pringles Original – per 28 g serving
| Item | Value |
|---|---|
| Calories | 150 |
| Total fat | 9 g (2.5 g saturated, 0 g trans) |
| Total carbohydrate | 17 g |
| Dietary fiber | less than 1 g |
| Sodium | 150 mg (7% DV) |
| Serving | about 15 crisps; about 5 servings per container |
EU Pringles Original – per 100 g and per 30 g
| Item | Value |
|---|---|
| Energy | 528 kcal per 100 g / 158 kcal per 30 g |
| Fat | 31 g per 100 g (of which 3.0 g saturates) |
| Carbohydrate | 54 g per 100 g |
| Protein | 6.2 g per 100 g |
| Salt | 1.0 g per 100 g / 0.3 g per 30 g |
| Serving | about 13 crisps |
When the Panel and the Database Disagree on Pringles Nutrition Facts
Two authorities looking at the identical 28 g serving return slightly different carbohydrate numbers. Kellanova’s SmartLabel panel states 17 g total carbohydrate. An independent database drawing on USDA records lists 16 g for the same serving. That 1 g spread is small, but it tells a household reader something useful: nutrition figures for a processed snack are declarations and re-measurements, not a single fixed truth.
The database side is worth naming precisely. myfooddata, citing USDA data, lists a 28 g serving at 150 calories with sodium of 150.1 mg – a figure that lines up almost exactly with the manufacturer’s rounded 150 mg. The calories match across sources; the carbohydrate line is where the extraction methods diverge.
The resolution for someone tracking intake: trust the manufacturer panel (17 g carbohydrate) for the product on your shelf, since that is the formulation Kellanova declares for that lot, and treat the USDA-derived 16 g as a laboratory-referenced value from a separate sample. Neither is wrong; they answer slightly different questions. For a look at how a database and a panel line up on a whole-grain product, Quaker Oats Nutrition Facts: What the Half-Cup Panel Actually Says walks the same comparison.
Wheat in a Potato Crisp: The Allergen the Name Hides
The word “potato” on the front sets up a false expectation. Both formulations contain wheat. The US SmartLabel declaration lists wheat ingredients as an allergen, and the European ingredient list spells out the composition in full: dehydrated potatoes, sunflower oil, corn flour, wheat flour, rice flour, maltodextrin, emulsifier (E471), rapeseed oil, salt, and annatto-norbixin colour.
Allergen warning
For anyone with celiac disease or a wheat allergy, this is the number that matters most on the whole panel – not a calorie count but the presence of wheat flour in a crisp marketed on its potato base. The European list also settles the oil question: Pringles Original in that market is fried in a blend of sunflower oil and rapeseed oil, not a single fat.
The corn, rice, and wheat flours together explain why a Pringle stacks and snaps the way it does rather than fracturing like a kettle-cooked potato chip: it is a reconstituted dough pressed to a uniform shape, closer to a formed cracker than a sliced potato. That structure is why the crisps nest so neatly in the tube – and why 15 of them weigh a consistent 28 g.
The 981-Calorie Tube: Serving Size vs How People Actually Eat
The label serving and the real portion rarely match, and Pringles makes the gap wide. Work through a full 185 g Original tube and you have eaten 981 calories, per bodypalapp.com, which puts that tube at 530 kcal per 100 g. The same source pegs the tin’s suggested 30 g serving, about 13 crisps, at a more modest 159 calories.
Set the sources next to each other and a small discrepancy appears between the brand’s declared value and a third-party recalculation. Either figure is close enough for planning. bodypalapp.com frames its percentages against a reference intake (RI) of an average adult at 8,400 kJ / 2,000 kcal, and a separate database, snapeatai.com, bases its estimates on an average adult of about 70 kg / 155 lb. Those baselines matter: a “13% of your daily intake” style claim only holds for someone eating 2,000 kcal, so read any percentage against your own target. The actionable point stands regardless of baseline – a whole tube is roughly half a day’s calories for that reference adult, which is why the 28 g and 30 g servings exist on the label at all.
Micronutrients, Other Tube Sizes, and What the Panel Leaves Out
The declared panels cover calories, fat, carbohydrate, sodium or salt, and protein, but stop short of a full dietary profile. Potassium, iron, and vitamin figures are not carried on the standard Original panels this desk aggregated, so a complete micronutrient breakdown is not something the current label data can supply. If you are tracking those, the panel alone will not answer you.
Package sizes are the other blank. The figures above cover the 185 g Original tube and the roughly 5-serving US can; smaller grab-bags, larger sharing tubes, and flavored variants each carry their own declaration and are not represented by these Original numbers. When comparing a snack against a whole-food reference, tables like Mozzarella Cheese Nutrition Facts: Reading the Panel Across Every Variety show how much a single product’s numbers shift across formats – the same caution applies to Pringles across tube sizes.
For the broader shelf of chips, crackers, candy, and bars sitting next to this one, the snacks sweets section collects the same panel-by-panel treatment across the aisle.
One Serving vs. One Tube: The Numbers the Serving Size Hides
The label answers per 28 g serving, but almost nobody pours a measured 28 g. Multiply the declared serving figures across the roughly 5 servings the US can holds and the total climbs far past the single-serving line the panel quotes. On the EU/UK side, the label’s tidy 158 kcal per 30 g serving turns into 981 kcal once the full 185 g tube is emptied – far more than the one serving the panel quotes.
- Per crisp: a single crisp is a fraction of the 150-calorie serving, so every handful of five adds up quickly.
- Whole US can (~5 servings): the 150-calorie serving, its 9 g fat, and its 150 mg sodium each scale up across the roughly 5 servings the can holds.
- Whole EU/UK 185 g tube: 981 kcal total – well beyond the 158 kcal the 30 g serving line reports.
That gap between one serving and one container is exactly where the label’s arithmetic stops helping and your own has to take over.
Frequently Asked Questions
How many calories are in one Pringle?
Working from the US panel, one 28 g serving of about 15 crisps is 150 calories, so a single crisp is a small fraction of that. That per-crisp figure is a division of the declared serving, not a separately measured value, so treat it as an approximation useful for portioning a handful rather than an exact per-chip lab number.
Do Pringles contain gluten or wheat?
Yes. The US SmartLabel declaration lists wheat as an allergen, and the European ingredient list names wheat flour outright alongside corn and rice flours. Anyone with celiac disease or a wheat allergy should treat Pringles Original as containing wheat despite the potato-forward branding on the front of the can.
Why does the EU label show salt while the US shows sodium?
The two markets follow different labeling conventions. The US panel reports 150 mg sodium per 28 g serving; the EU Original label reports salt at 1.0 g per 100 g and 0.3 g per 30 g. Salt and sodium are related but not identical measurements, so a grams-of-salt figure cannot be read directly as a milligrams-of-sodium figure without conversion.
How many calories are in a whole tube of Pringles?
bodypalapp.com puts a full 185 g Original tube at 981 calories, calculated at 530 kcal per 100 g. Against a 2,000 kcal reference intake, that is roughly half a day’s energy from one tube – the reason the label breaks the same tube into a 30 g serving of about 13 crisps at 159 calories.
Why do the manufacturer and USDA carbohydrate numbers differ?
Kellanova’s SmartLabel panel states 17 g total carbohydrate per 28 g serving, while myfooddata, citing USDA data, lists 16 g for the same serving. The 1 g spread reflects the difference between a manufacturer declaration and a laboratory-referenced sample. For the exact product on your shelf, the panel value is the closer match to that formulation.